


Register for a Free Live Training
Hot Stocks Outlook uses VantagePoint’s market forecasts that are up to 87.4% accurate, demonstrating how traders can improve their timing and direction. In this week’s video, VantagePoint Software reviews forecasts for SPDR SPY($SPY), Northrop Grumman ($NOC), Franco-Nevada ($FNV), Apple ($AAPL), Crocs ($CROX), ULTA Beauty Salon ($ULTA), Nike ($NKE), and Home Depot ($HD)
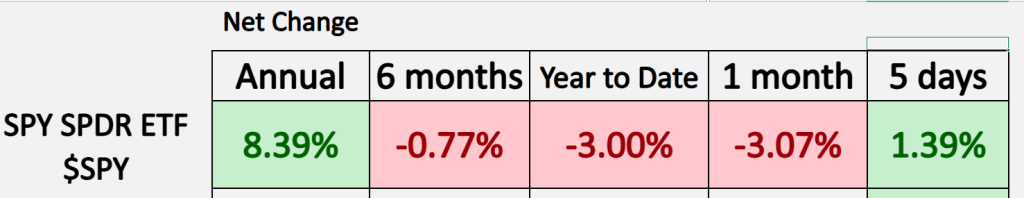
SPDR SPY ETF ($SPY)
VantagePoint A.I. Hot Stocks Outlook for March 28, 2025.
Hello again, traders, and welcome back to the hot stocks outlook for March 28th, 2025. I hope you all had an excellent week out there in the financial markets, and as always, we’re here to take a look at the most recent Vantage Point AI predictive forecast. So, if you haven’t already, make sure you go ahead and click on that link down in the description below, and you can get signed up for a live demonstration and learn all the specifics about how these predictive indicators and technologies are helping traders make better trading decisions when out in the marketplace.
Now, as we typically do, we start out by taking a look at the S&P 500 via the Spy ETF, and so we can see year-to-date here we are down 3%. Not a lot changing here, most of that coming in the last 30 days, and we’ve seen markets perk up just a little bit here over the past five trading days. So, I want to highlight how the Vantage Point forecasts are getting ahead of this, and also how Vantage Point traders can just use the indicators, and use, you know, even things like the scanning feature to really identify where are the strongest markets.
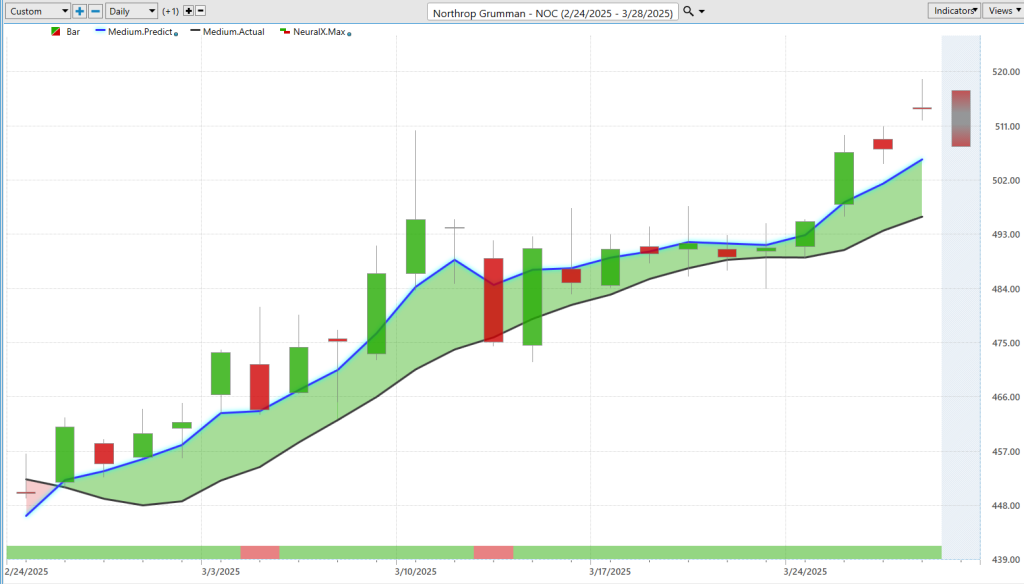
So, let’s start out here with Northrop Grumman. Right, so what we have here are daily bars and candles, and we actually ended on this chart last week, so I think it’s a good example to go ahead and update how all these short-term predictive indicators work. And so what we’re seeing against all of those daily bars and candles, well the first thing that you’re going to notice here is this black and blue line value. So, the black line that you’re seeing there is actually a simple moving average. It’s a very common technical analysis indicator. In this instance, it’s a 10 period, so, right, so to look back at the previous 10 closes, add them all together, and then divide by that number. And so, what this does is smooth out the existing price action, right? It lets us know where market prices have been, and it gets rid of some of that day-to-day market noise, but all the data to generate that tool is coming from the past, right? It’s really just summarizing what’s already occurred. Additionally, the second major weakness is that it’s only looking at Northrop Grumman in a vacuum, right? It’s not accounting for how other markets may be affecting and influencing future prices. And this is where Vantage Point traders have a huge edge.
So, what we notice is that blue line value on the chart, moving above the actual moving average here back on 2/25. And so, to generate that blue line, which is essentially a prediction of future prices that are getting plotted on the chart, well, that is where the technology of artificial neural networks come into play, and they’re performing what we would call intermarket analysis. And so what that means is, specifically for Northrop Grumman, there are known market relationships that can drive and influence future prices. Now, some of these things will be quite obvious, like the broader S&P 500 and the broader indices, the ETF groups that maybe wrap up the indices, but also just the defense stocks, right? Defense ETFs. This can also find individual stocks, whether they be competitors, maybe like Raytheon and Lockheed Martin, but the software is also able to pick up these subtle relationships that humans just really wouldn’t have the horsepower to detect. Some of these may be leading or lagging relationships; some of them may be inverse correlations. And so it’s able to take all of that information in, find those significant relationships, and this goes all the way down the line to things like the value of the Dollar Index. We’ve seen gold and copper prices make huge moves over the past few months, and so it’s going to incorporate specifically to that market what are influential into those future price forecasts and developing a very highly robust and consistent forecast and prediction. And so, whenever we see that blue line cross above the black line, well, it’s those in-market relationships skewing this tool, in this case, to the bullish side, and letting us know where likely going to start seeing those average prices start to go higher. So, you see about a 13, almost 14% move just over the past 23 trading days.
But what I want to highlight as well is the short-term predictive indicators, this being our, you know, overall trend, our predicted moving average. Well, if we look at the very bottom of the chart, you see this bar, and you’ll see it goes from red to green and back to green, red. Well, this is an indicator that’s tuned to solve a different problem for the trader, being a much more short-term problem of what’s likely to occur in the next 48 hours, right? Strength or weakness in the market. And so, this indicator, whether it’s through earnings, Fed announcements, all of these things, has an extremely high level of accuracy across all of the markets that are forecast. So you’re looking at over 80 plus percent accuracy, and again, this is wide-ranging through earnings reports, announcements. And so this is likely to skew in the direction of where short-term prices are headed, and we see over the past five trading days, well, it’s saying, look, the trend is up, and that neural index is forecasting strength over the subsequent 48 hours.
Now, in addition to that, if that wasn’t enough, you’re also provided a predicted high and a predicted low value. So now, getting down to intraday price levels, and again, there’s a separate technology package here of the artificial neural networks solving these different problems of the overall moving average, that neural index, both the predicted high and predicted low, and then we can look back as we do each week and say, well, how accurate are all of those predictions against what actually occurred in the market?
And so, Northrop Grumman here is a really great example of this. Go back last week, before Friday’s trading day, right at the end of Thursday, things are still very, very bearish across, especially the Spy and the equity space, but in Northrop Grumman, we say, okay, well, here’s some strength, and when we look at those forecasts going into Friday, what actually occurred was we came right down to the Vantage Point predicted low, and it’s pretty much been five days moving higher. And you know, you’ve had about a 13 or 14% move over the past, you know, month and a half or so, well, 6% just over the past five trading days from those predicted lows from last Friday. So, really nice opportunity here in Northrop Grumman, not just the overall trend, but just using the short-term predictive forecast and updating as we move forward through time.
So this is how traders are getting really the benefit of these highly accurate predictive indicators to, again, match their trading strategy and approach and know what they like to do in the marketplace.
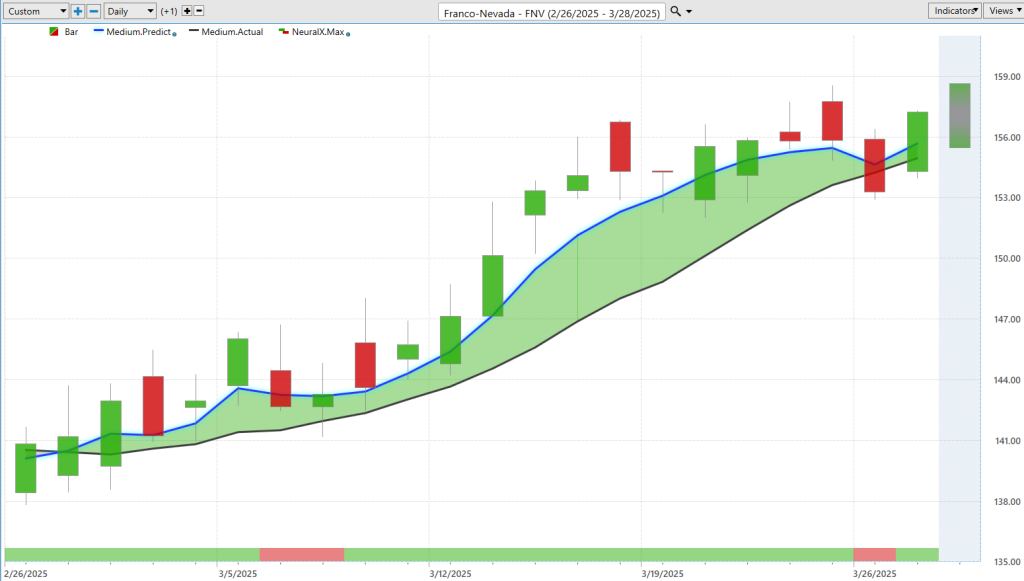
Now, here’s Franco-Nevada. I keep coming back to a lot of the mining companies because again, copper, gold, platinum, a lot of these markets have had really great moves, and certainly stocks are going to benefit, and this is a great example of those in-market relationships, right? It’s not just about, you know, the mining ETFs, and it’s not just about gold prices; it’s able to look at all of these intermarket relationships and say, okay, well, how are all of these skewing to the bullish side, and, you know, creating, in this case, a bullish forecast. Well, here we see very similar, that blue line crossing above the black line. You will get these periods where the neural index may go down to a bearish configuration, but again, remember, across all markets, this is an extremely high level of accuracy, typically around 85%. And so when we see that there’s going to be those potentially short-term dips within the uptrend, we can accommodate for that and incorporate that into our overall trading. But again, of course, let’s just look back at the Vantage Point predicted highs and lows. So again, we looked at this last week, so, you know, the bulk of this move moved higher, but over the past five trading days, well, what information does the Vantage Point trader have to make trading decisions? Well, it says, going into the week, buy down here, you know, below 155 here, down at that predicted low. We see yesterday moving down towards the predicted low again. And this is why this is so important for short-term traders, is you see this sort of price action a lot; the market closing lower, and the next day is really where we move up towards the subsequent predicted highs, and really just how you have to navigate the market to make a profit, right? Because you’re going to give up a lot if you, you know, don’t buy into the market; it’s immediately gapping up and going higher in the direction of the uptrend.
So again, just wanted to review some of these opportunities that we’ve looked at because this is extremely important. It’s not just about identifying the crossover, and this is where Vantage Point and Intellis Scan is really helpful for actually alerting traders to, right when that is occurring, but updating and managing the opportunity as we move forward through time.
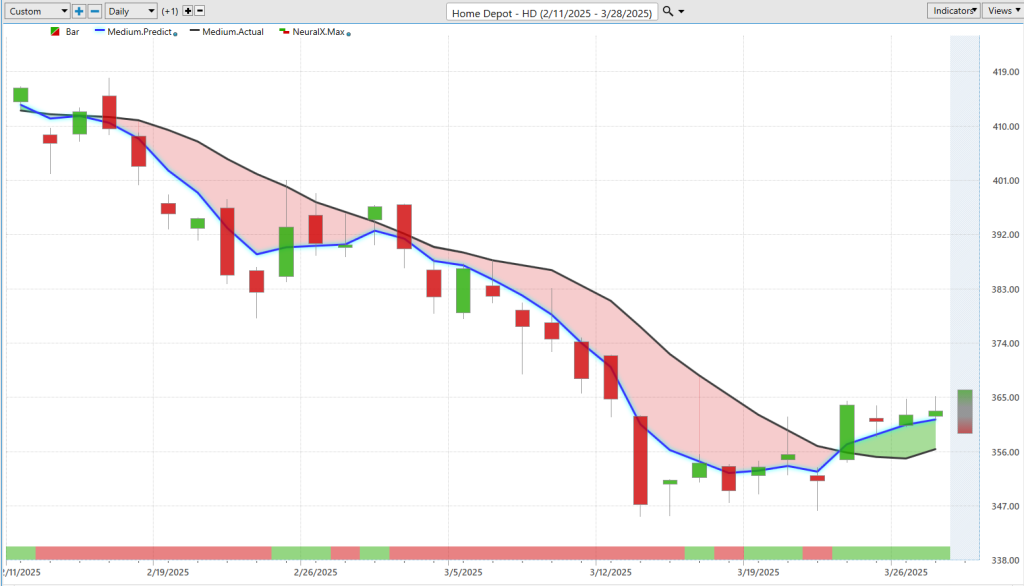
Home Depot, this was another market that we looked at on the bearish side last week, and a good example of again, how the predictive indicators work as a package to help traders get ahead of potential strength or weakness in accordance with your overall strategy. So we look here and look at the index here, right? So that’s your 48-hour indicator of strength or weakness in the market. You’ve got 1, 2, 3, 4, 5, 6, 7, 8, n, essentially 10 days there, and you can see it’s potentially wrong maybe twice here, again, about an 80% accuracy as far as predicting where prices are likely to go next. And more recently, you see actually getting that crossover to the bullish side. So since that crossover has come through, we’ve seen the market sort of grind higher here, definitely an opportunity to cover shorts, right? If you’re still short the market, and you see the market again, moving up towards these predicted highs, and that’s where we see it sort of settling out on an intraday basis. But again, I just wanted to bring this through to highlight that, and we can use these tools every single day, right? When we’re on the bearish side, using those predicted lows to short, take profits on shorts, but recognizing that, okay, well, when things start to shift, well, we want to change that behavior, and if anything, look to be buying down at those Vantage Point predicted lows here.
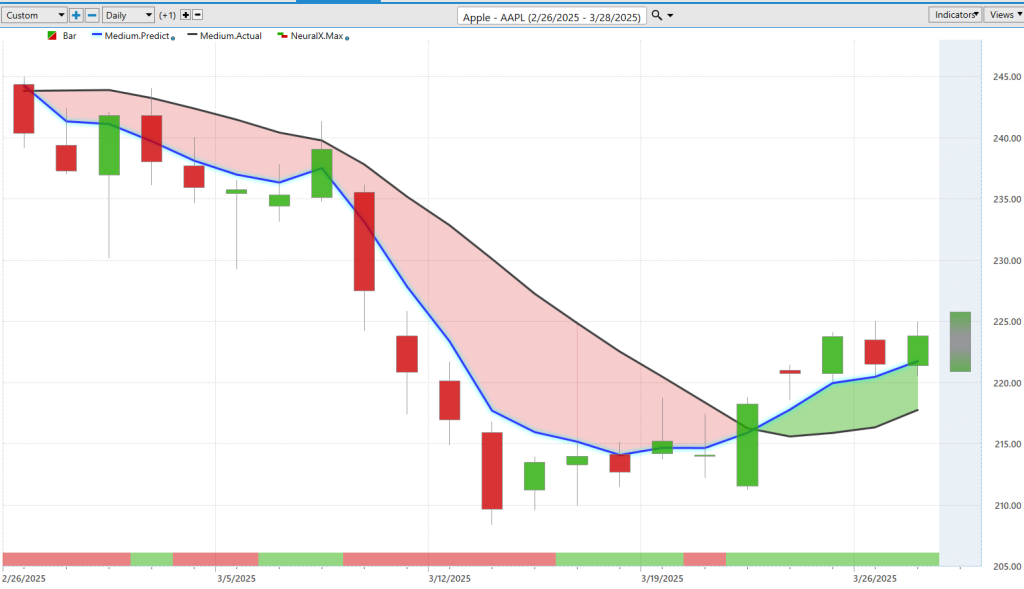
Now, a really great example here, I’m actually going to skip, we’ll go past Nike, but here’s Apple, and again, this is just a really great example of how the suite of these indicators and tools work together where you see again, we have Apple in a downtrend, this again, another market that we looked at last week. Look at all the strength from the neural index, additionally, as we come into this low. So, you know, on all of these days, right, you’re getting information over and over and over again, outside of this one day, that prices are very likely going higher, right? So you’re getting multiple days where it’s just for a short-term trader, skewing to the bullish side, and look how accurate all these predicted highs and lows are. So if you’re trading the market actively, and you know, shorting at predicted highs, targeting predicted lows, you, we actually moved down towards this predicted low pretty much perfectly, and then that’s where we start moving higher. Here we have on Wednesday in the middle of the week here on Apple, now that we moved into an uptrend, moving down towards that predicted low and up towards a predicted high for about, you know, one and a half percent move, nice little short-term day trading opportunity there, potentially. But certainly, now this market is in an uptrend, right? Blue line over black line, and so if we want to look to do some trading, well, we can find those markets that have been in an uptrend or in strong, you know, showing strong signals, are potentially recognizing some of these reversals taking place.
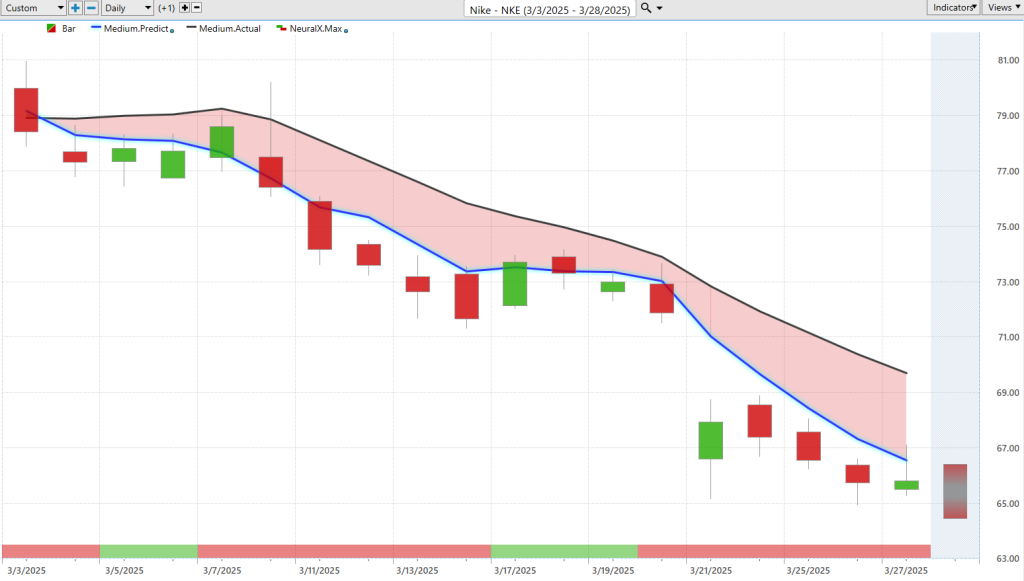
Nike, shares of Nike, this is another market that we looked at last week, very, very bearish, responding bearishly to earnings, and you see no strength here, right? So as we get all that noise around the earnings report, what’s going to happen is the software is going to go, okay, something big happened here, right? It doesn’t understand that earnings happen and there’s this huge sort of catalyst and volatility in the market, but that’s really the beauty of this, is it takes in that information, assesses the scenario, looks at those intermarket relationships, and then forecasts moving forward for the trader, right? So as we see that big move across earnings, look how quickly the software just gets back online, right, saying here, look, down towards these for your Vantage Point predicted lows, up towards these for the predicted high, but still skewing to that bearish side. So even as we’ve seen some markets recover, this clearly not one of those areas where you’re getting any strength out of the Vantage Point predicted neural index.
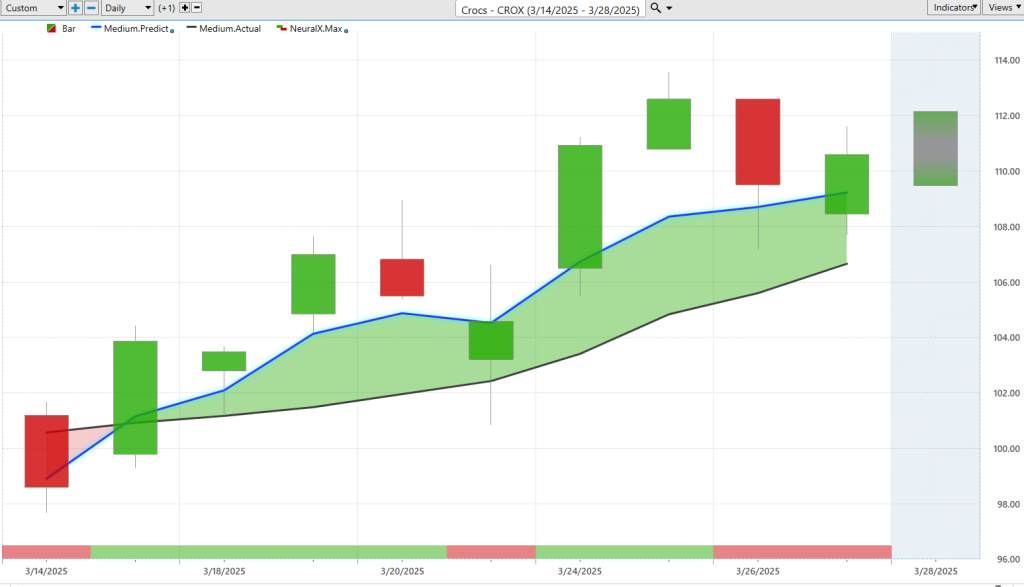
Here, we can move forward to shares of Crocs, and again, I’m just highlighting some of the strength that we’ve seen come in as the markets, you know, the S&P and the broader markets there, we see bottom started to bounce higher. This is where again, it’s especially important to use Vantage points tools like the Intellis Scan to really hone in on where are the strongest markets, right? Where are the markets that have really strong crossovers, a lot of distance between that blue line and the black line, and then, of course, you know, shorter-term traders, or you know, adjusting your position or adding your position, this is where these short-term predicted high and predicted low levels are really exceptional. So again, these are great days like this, where if you have an order waiting, you’ll get filled at the open, but you know, when you get comfortable with the software, you notice these sort of things all the time, right, of look at this trading day, you get a gap up, the market goes all the bullish price action, right, you know, we’re in a bullish forecast here, so we expect the market to go up, but when you never hit these predicted lows, you can really be prepared for that, and you see the gap gets filled, we move down to those predicted lows, and then the overall trend resumes here. So when you have all these levels ahead of time and really understand what to expect, this makes things, you know, much easier for traders, and you see even before that, you know, trading day, it’s a lot of separation between that predicted moving average and the actual moving average, and still in an uptrend here. Additionally, just, you know, really short-term neural index gets bearish, you know, maybe take some profit up at the predicted highs and do some trade management, buy back at lower prices, if you want to, you know, keep exploiting that bullish opportunity there.
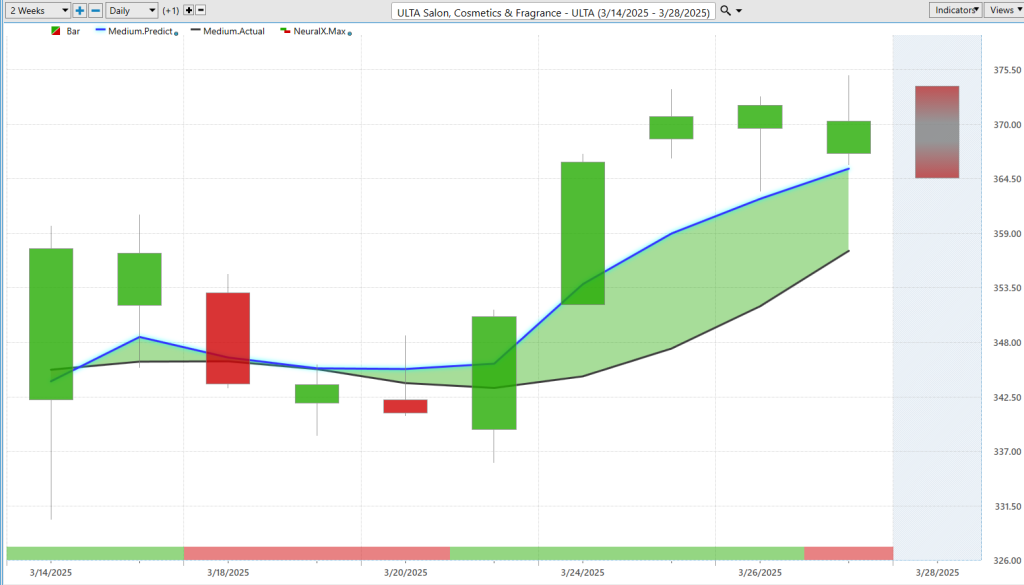
Here’s Ulta, and again, just the last example to end on here, and seeing some of these markets start to so as you get these, you know, in-market relationships skewing, and hopefully helping create some strong signals for you, this is where the Intella Scan is going to pick up on a lot of this strength coming into the market. So even with this volatility that we’ve seen, you see the neural index goes bearish, you get those subsequent lower lows in price action, but notice on here how you’re actually getting more and more separation between that predicted moving average and the actual moving average, even, you know, on that down day, and then we see, you know, shares continue to advance here. So again, we can look at these Vantage point predicted highs and lows when you’ve got these levels really every day to help guide you make a big difference on, you know, how efficiently you know you’re getting in and out of the market and potentially taking profits on those bullish opportunities or trades. So, a little opportunity there again, just wanted to highlight some of the, you know, shorter-term forecasting here. We have seen a shift at some of these lows, you know, Apple‘s a good example, Home Depot, but you want to be very careful here, right? And understand that we’ve still got a lot of volatility in the market, really hone in on these areas where yeah, there’s a lot of persistent strength, and then of course, we can use those Vantage Point tools to really manage the opportunity effectively, then see where these things go, right? So, you know, last Friday, you have no idea that, hey, yeah, this will be 6% higher, but you do know that, look, the opportunity is down here at these predicted lows intraday, and then we can just keep managing that opportunity as we move forward through time.
So I’ll go ahead and leave it there. Once again, it’s been the hot stocks outlook for March 28th, 2025. Thank you for watching, best of luck, and bye for now.


