


Register for a Free Live Training
The Hot Stocks Outlook uses VantagePoint’s market forecasts that are up to 87.4% accurate, demonstrating how traders can improve their timing and direction. In this week’s video, VantagePoint Software reviews forecasts for SPDR SPY($SPY), iShares Russell 2000 IDX ($IWM), Meta Platforms ($META), Amazon ($AMZN), Paypal ($PYPL), Monster Beverage ($MNST) and Colgate-Palmolive ($CL)
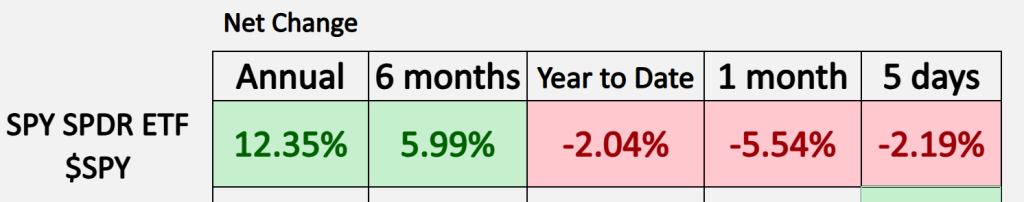
SPDR SPY ETF ($SPY)
Hello again, Traders, and welcome back to the Hot Stocks Outlook for March 7th, 2025. I hope you all are having an excellent week out there in the financial markets and, as always, we’re going to take a look at the most recent Vantage Point AI predictive forecast. If you haven’t already, make sure you go ahead and click on the link down in the description below and get signed up for a live demonstration, so you can learn all the specifics about how these predictive indicators and technologies are helping traders make much better trading decisions out in the marketplace.
Now, as we typically do, we start out by taking a look at the S&P 500 via the Spy ETF. Immediately what jumps out is that, year to date, we are down 2%, and that’s because in the last 30 days we’ve seen a lot of weakness across the market.
iShares Russell 2000 IDX ($IWM)
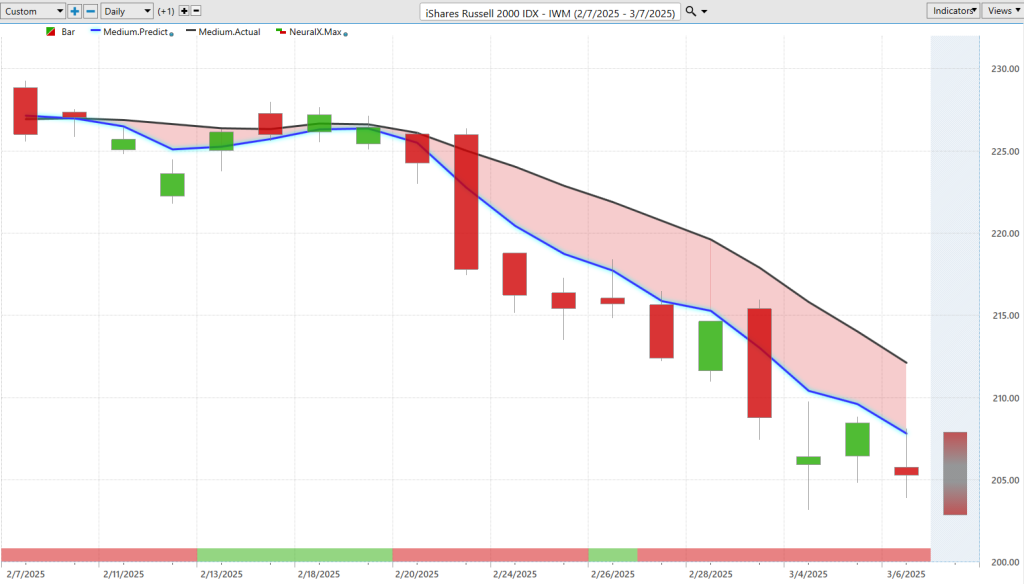
This is why last week we were looking at Meta and a lot of these shares that have really highlighted that the broader market has turned lower, and definitely a great place to highlight that are shares of iShares Russell 2000 IDX ($IWM), the IWM, or these small-cap Russell 2000 Index.
This is a really great example to highlight how all of these predictive indicators work. What we’re seeing here is daily price action; right, so each one of those candles is going to represent a full and complete trading day, and right up against that price data, you’re going to notice that there is a black line and also a blue line value. The black line that you’re seeing there is actually a simple moving average. This is a very common technical analysis indicator; in this case, this is a 10-period, so it to look back at the previous 10 close prices, add them all together, and then divide by that number. A lot of the weakness with traditional technical indicators like this is that all the data comes from the past, so it’s really just summarizing what’s already occurred in the market. So what Vantage Point traders are able to do is compare that black lagging moving average to the proprietary predicted moving average, generated via Vantage Point’s technology. We can think of this as a prediction of future average prices plotted on the chart, moving forward every single trading day.
To generate these predictions, this is where the technology of artificial neural networks comes into play, and they’re performing what we would call intermarket analysis. So specifically, here on shares of IWM and the Russell 2000, well, there are known market relationships that give us valuable clues into future price direction. So those can be individual stocks throughout the index, right, those you know, stocks that are overweighted on the index and have can have some influence; this can be other ETFs or other broad futures market indices, but it’s also able to look at all of these things like global interest rates or potentially currencies where we’ve seen a lot of big moves in the Euro and the dollar this week. And this really takes us all the way down even to things like global commodities, right? So, gold, oil, whatever is specific to the market that you’re trading. So it’s taking this approach of looking at dozens of other markets, understanding those bullish and bearish relationships, how they’re weighing on the stock that you’re trying to trade, or in this case, an ETF, and then providing these valuable price clues.
So, whenever we see that blue line cross below the black line, it’s because those intermarket relationships are skewing this indicator more and more bearishly. Now, since that forecast has come through, what we’ve seen that well, shares of the Russell, specifically, and really the broader indices, whether it’s the NASDAQ or the S&P 500, have moved lower, but we’ve seen the most weakness here where we’ve seen here in the Russell, that blue line moving, you know, decidedly below that actual moving average and creating really the most distance here, highlighting a lot of weakness here.
Now, at the very bottom of the chart, you’ll see this bar that goes from green to red back to green. Well, this is also utilizing that predictive technology but tuned to solve a different problem over a different timeframe here. And in this case, it would be short-term strength or weakness, just over a 48-hour period or a couple of candles. And so, we’ll notice that when that neural index gets bullish, well, we get a consolidation in the market, we get a sideways price action, but the overall trend is still bearish as that predicted moving average remains below the actual moving average. You get a little blip here and immediately, the neural index remaining bearish here, and we see that weakness carrying out. So really nice opportunities throughout the broader markets but on the bearish side and specifically if you just want to generalize that weakness, I think the Russell sort of stands out as a place to go ahead and do that.
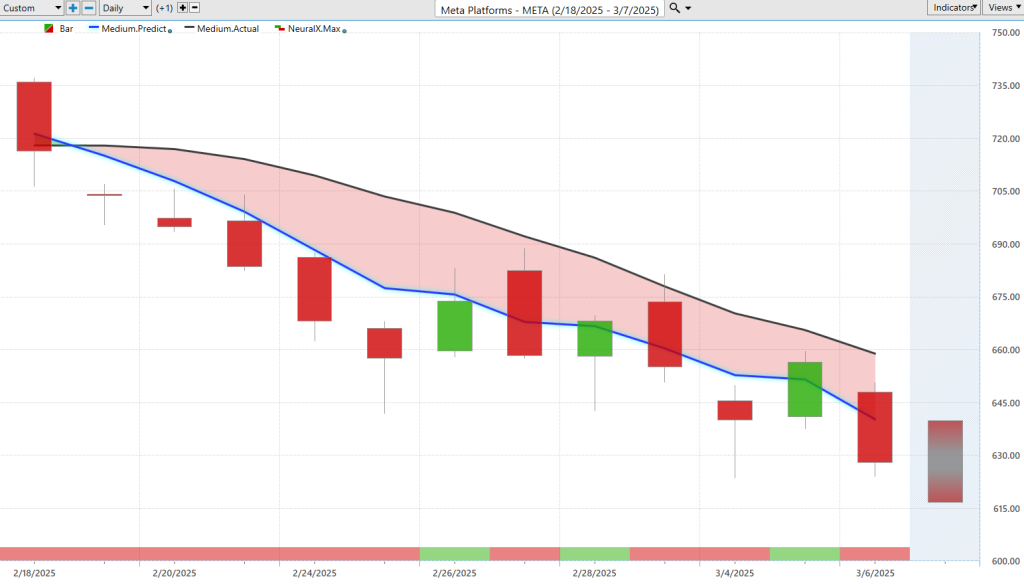
But here’s Meta Platforms ($META), shares of Meta, and so we looked at this last week and highlighted that look, the broader markets turned lower; we actually looked at this as the market was trending higher here in Meta, and catching this fresh downtrend. So what I just want to highlight is that we have these predictive indicators and tools to guide us moving forward, and so we can see that trend is in a strong downtrend, we see a lot of separation this week between that predicted moving average and the actual moving average, and we’ve got our neural index well, which at times will push up to a green configuration, but again, you could only be shorting, take profits on shorts, and you see you get that sort of choppy, uh, uh, choppy price action.
But in addition to those predictive indicators, Vantage Point’s also providing a predicted high and a predicted low, so when it comes down to intraday price or day trading, these are levels that are provided via also that predictive technology, but now again, tuned to solve an even shorter-term problem of intraday price action. So if we bring up all of those predictions against the actual market data, well, we can see what has been the forecast here for Meta. Well, clearly, we’re in a downtrend, and you’re getting these levels highlighted as really the extremes of intraday price, that if you want to take a short position, well, that’s where you’d want to look to. So you actually see this is actually Monday this week, this is Wednesday this week, and again, these markets moving down towards these predicted lows, uh, where traders can look to take profit or keep establishing or building a position here. So we see the trend still bearish, uh, overall Meta shares now down a little bit more here again, not as much as that, uh, uh, you know, 16% on the Russell here, um, but off about 10% here just in the past uh, 11 trading days here.
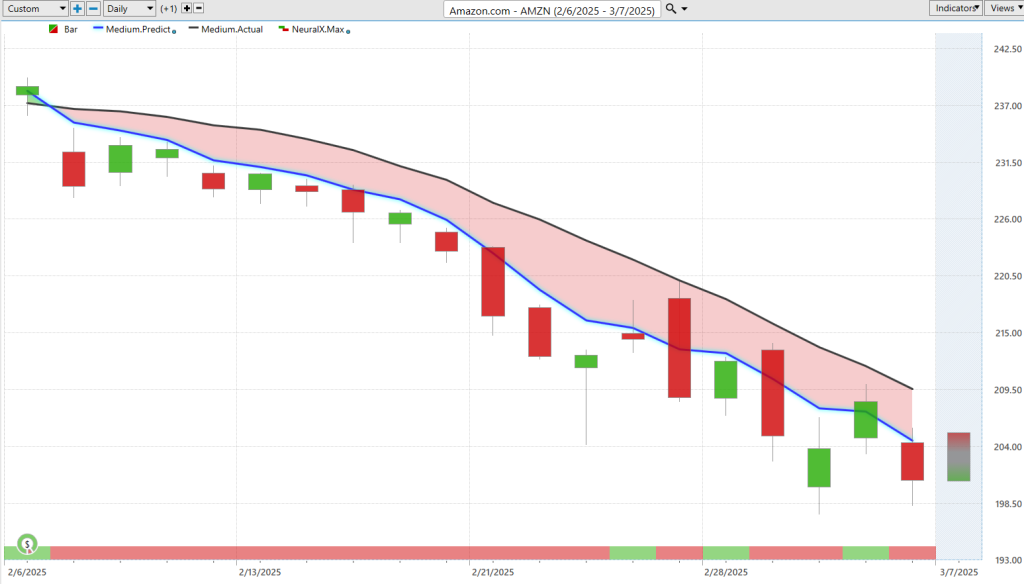
Uh, here are shares of Amazon ($AMZN), and we looked at this last week as well, so I wanted to just again highlight some of these shorter-term predictive indicators but again, highlighting that broadly there’s market weakness, right? We’re looking at Meta, Amazon here, the major indic, and recognizing that there’s broad-based weakness across the market going into the market this week. Well, we can look towards those short-term predictive indicators, and again we have these predicted highs standing out as, okay well if you’re doing any trading, clearly in Amazon it’s saying the trend is lower, uh we may get some choppiness with that neural index going bullish, but you actually see what’s interesting about this is if you have a limit order waiting on a trading day like this, you’ll just get filled at the open as the market gaps up and immediately that weakness plays out and the market starts trading lower. Uh, so again, the next day, pretty much filled at the high at the high here, uh, and and benefiting as we see this weakness again across prices generally.
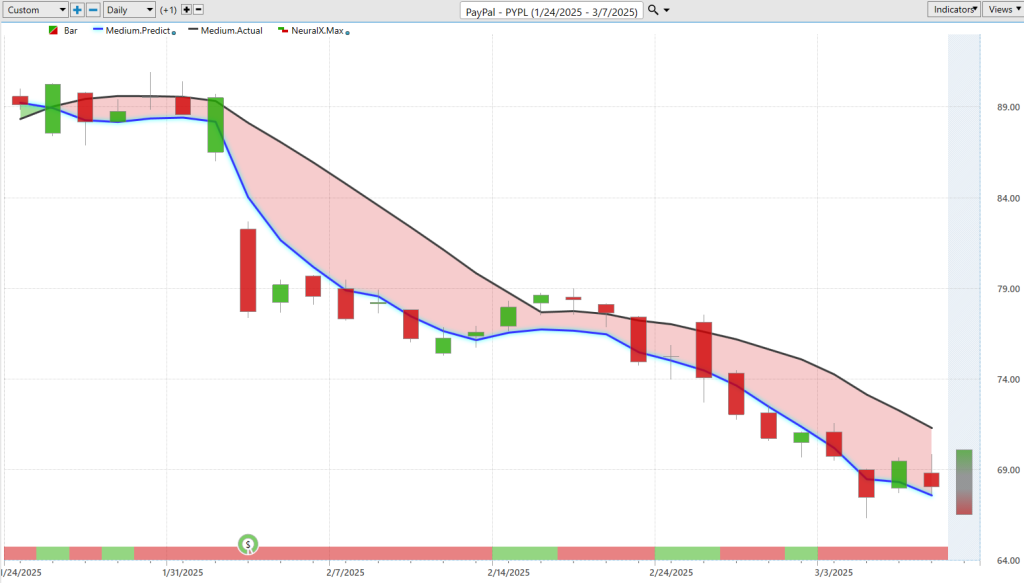
PayPal ($PYPL), here so this was another market that we looked at again just using this examples to highlight these short-term forecasts because if we can come in and say okay well we knew these markets are already in a downtrend, well then we can evaluate these short-term predictive indicators, these predicted highs, and lows that traders are using week to week. And so again, here we see moving up towards these predicted highs, uh, and failing, and this is where we can use tools like this to potentially build a position with profits from earlier on in the trading opportunity, right? So if we recognize these reversals early, we may be able to establish a position both in the short term, uh, but holding out for the long term as these bearish trends continue.
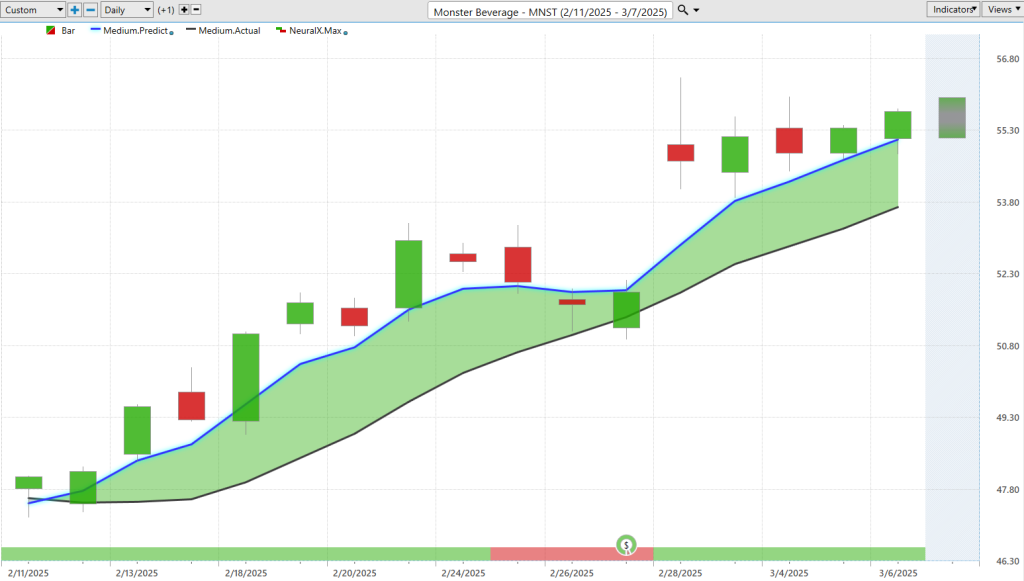
Now I wanted to flip things around here just to highlight that the Vantage Point indicators work regardless of the broader market condition, so certain individual stocks, well, are currently in an uptrend, and so if you’re trading, uh Monster Beverage ($MNST), or potentially looking for bullish opportunities, well, here we see Monster Beverage, one of the fewer areas in the market where that blue line is solidly above the black line, neural index bullish. Now we have earnings right here in the middle of the chart, but notice how even despite earnings, how accurate all of these forecasts are. The overall trend is up; certainly, there
‘ll be some volatility around earnings. Well, where’s that likely to show up? Well, when that neural index is bearish, and you see we get some weakness over those subsequent trading days. But as soon as you get through earnings, that neural index goes bearish, and even in a very bearish market week here, you see the Monster Beverage forecast being like, look, the trend is up, a short-term forecast from the neural index are bullish, and if we want to look towards intraday levels, well, here on Monday, Tuesday, and here Thursday, uh, being levels to potentially be a buyer and take profit as we move up towards these predicted highs, uh, just modeling what those short-term forecasts are highlighting.
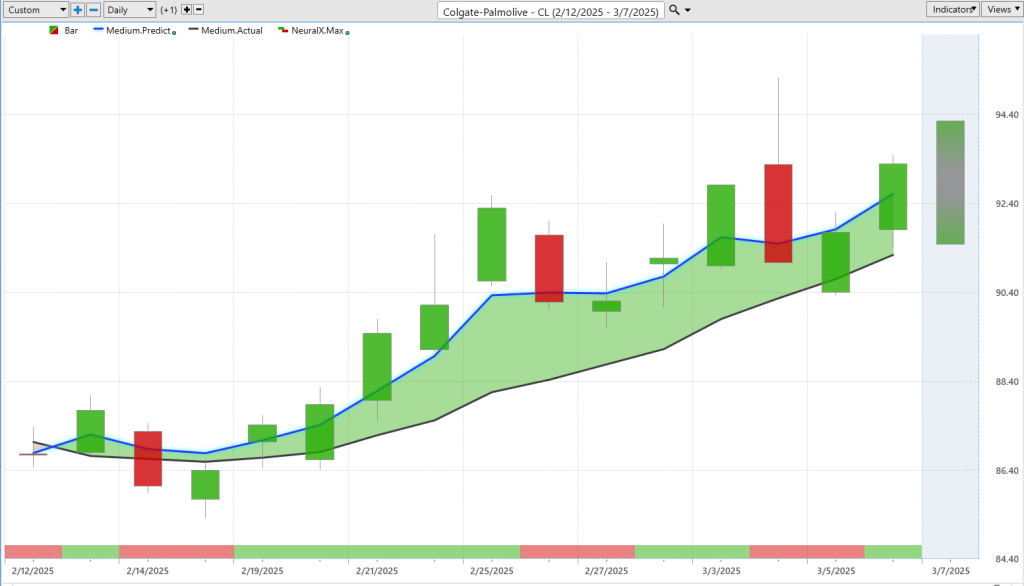
Additionally, here Colgate-Palmolive ($CL) has been another one of these rare instances where a lot of strength from our blue line above the black line. Again, you’ll get these periods where you see early on, the neural index gets bearish, and you get a little bit of a gap down the next trading day, but the Blue Line every single day remains above the black line, and so overall, the trend is bullish here. Again, we see these little gap down, uh, days coming after that neural index gets bearish, and again, we can look towards the Vantage Point predicted highs and lows, and you see how this works here is even early on, where you get that snap lower, what’s happening is you’re just moving down to that previous predicted low level. And within that, you know, 24-48 hour window, you’ve got excellent levels and guidance here, uh, to be a buyer in the market and know what levels are appropriate here. So again, you see about four or five entries, uh, on the way up, but again, noticing that broadly here, the overall trends are bearish, right? So, you know, bringing this through just to sort of add some context of, you know, even in a bearish market, well, where there’s strength, these indicators will skew in this case to the bullish side, uh, and you see actually a lot of separation there, right? So, going into a week like this, where we’ve just gotten more weakness from the broader market indices, very clearly here, Colgate, and Monster, uh, in a pretty strong uptrend.
So, we’ll go ahead and leave it there. Obviously, a very interesting, important week for the broader markets, uh, and important to really be ahead of a lot of these big market shifts. So, if some of these things are catching you by surprise, and maybe you’re, uh, uh, noticing your tools are a little bit lacking to get you ahead of some of this market weakness, well, definitely go ahead and click on that link in the description, uh, get some more information about these predictive indicators and tools. So, once again, this has been the hot stock outlook for March 7th, 2025. Thank you all for watching, best of luck out there, and bye for now.


