


Register for a Free Live Training
The Hot Stocks Outlook uses VantagePoint’s market forecasts that are up to 87.4% accurate, demonstrating how traders can improve their timing and direction. In this week’s video, VantagePoint Software reviews forecasts for SPDR SPY($SPY), Duke Energy ($DUK), Pacira Pharmaceuticals($PCRX), Global Foundries ($GFS), Taiwan Semiconductors Manufacturing ($TSM), Humana ($HUM), Oracle ($ORCL)
SPDR SPY ETF ($SPY)
Hello again, Traders, and welcome back to the Hot Stocks Outlook for May 17th, 2024. I hope you all are having an excellent week out there in the financial markets. As always, we’re going to take a look at the most recent Vantage Point predictive forecast. If you haven’t already, make sure you go ahead and click on that link in the description below so you can sign yourself up for a live demonstration and really learn all the specifics about how these predictive tools can help you make much better trading decisions in the marketplace.
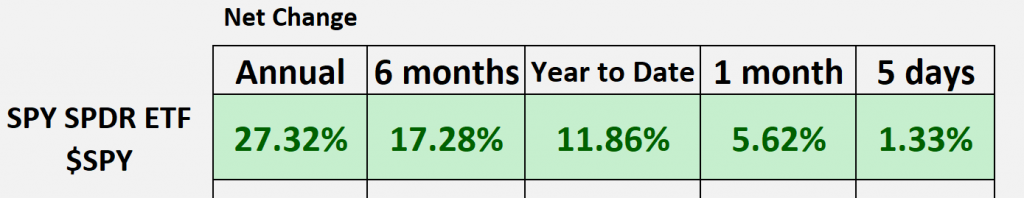
Now, as we typically do, we like to look at the SPDR SP ETF ($SPY) just to get the sense of the broader market and where things are at. We’ve had a really nice rally over the past month, pushing us up to about 12% year-to-date. We really want to understand where the stocks that are doing exceptionally well are, and this is where VantagePoint’s predictive tools do a really great job of alerting traders to where that strength and opportunity are in the marketplace.
Going back into our Vantage Point software, what we can do is go ahead and review these opportunities, but many of these are from the previous several weeks, highlighting how we can use these predictive tools and then look at those updated forecasts to guide us moving forward.
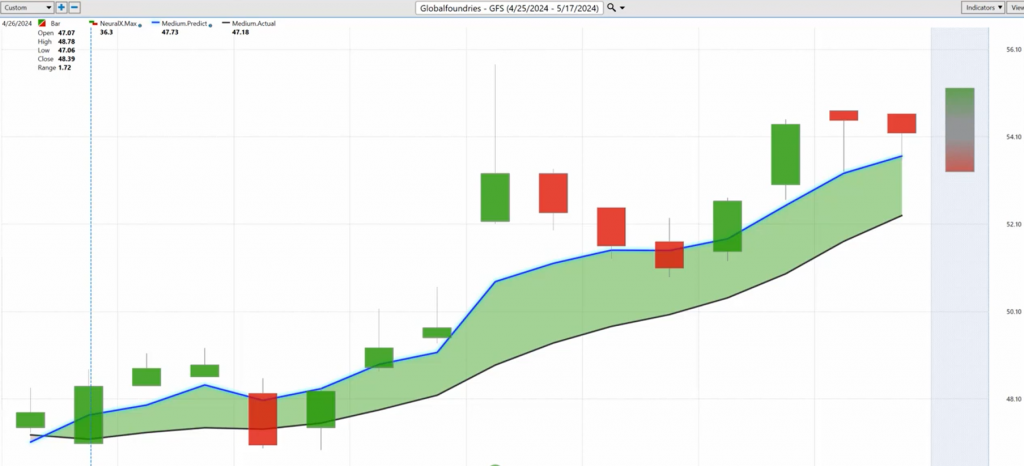
Last week, we looked at GlobalFoundries ($GFS), which is a really good example of what we’re seeing in the tech space. We talked about the biotech and healthcare space, actually doing quite well as well. Here in GlobalFoundries, it’s a really good example of how all these predictive indicators work together.
You see, each one of those candles that you see represents a full and complete trading day. Right up against that price data, you’ll see there is a black line and a blue line value. The black line value, that is actually a simple moving average. This is a very common technical indicator. In this case, it’s a 10-period simple moving average, so it looks at the past 10 closes, adds them all together, divides by 10. But the problem with technical analysis tools like this is that all the data used to generate that value is coming from the past. In this case, the last 10 close prices, but it’s also looking at one market in isolation, meaning it’s only looking at what’s most recently occurred here in shares of GFS.
So, that’s a good marker, what we can call really our baseline, to understand where market prices have been, but as a trader, we need to be ahead of that next move in the marketplace. And so, what we want to do is compare that to this proprietary predicted moving average, and for this number, essentially a calculation of future price for that to get calculated and plotted on the chart every evening. Well, this is where Vantage Point’s technology of artificial neural networks comes into play and performs what we would call intermarket analysis.
Now, Global Foundries here is a tech stock, right? So we can understand that there’s going to actually be some important market relationships between other tech stocks. You see, we have TSM, Nvidia, AMD; it’s going to look at ETF groups, right? That wrap up a whole grouping of tech or chip stocks. It’s going to again look at those individual stocks. It’ll look at global currencies; the value of the dollar index has a huge implication on whether stocks go up or down. It can look at global interest rates and also things like commodity markets, whether it be gold or oil, or whatever. These specific intermarkets are driving that asset that you’re trading, right? So it’s going to have its unique set of intermarkets, essentially the data sets that are used to be plugged into these neural networks and to generate these highly accurate forecasts.
Once it looks at all that inner market data, it’s generating these highly accurate price predictions, and it’s those price predictions that are used in the calculation of these indicators, turning what are really lagging tools into forward-looking predictive indicators. This really works across the board, and we can use tools like VantagePoint and Telescan to actually see where these predictive indicators are skewing bullishly.
On 4/26, we see this on GlobalFoundries, the exact same thing on TSM, Nvidia, and a lot of these chip stocks, indicating that the overall trend is expected to start moving higher. Now, each week we take a look at the very short-term forecast from these tools, and what I want to do is explain really that here, here in GlobalFoundries. So if we look at the very bottom of the chart, this bar that you see that goes from green to red and back to green, well, this is a 48-hour indicator. It’s utilizing the same technology of artificial neural networks but it’s tuned to solve a different problem, in this case just short-term strength or weakness over the next couple of trading candles. And so, you see that when that neural index goes bearish, you tend to get a couple of days of price weakness, sometimes lows pushing past some previous lows, but the overall trend here, we can see with that blue line over the black line, very much to the bullish side.
We got a really nice move here in GlobalFoundries, about a 14%, almost 15%, move in the past 15 trading days. But we got to remember, we’re also given a predicted high and predicted low, so if we want to do some short-term trading, add to positions, maybe do some day trading, this is where these tools can be extremely effective. When we come back and look at GlobalFoundries, I think last week what I wanted to highlight is we see this a lot where you see all the price action takes place on this bullish side, you get no selling, and then a couple days later you zoom right down into those predicted lows, and we start this advance. But more recently, what have these short-term predictive forecasts been showing? Well, they’re saying, look, look down towards these VantagePoint predicted lows, so this right here would actually be last Friday, and we’ve seen what’s happened in GFS and the tech stocks and really across the board. Well, you’ve gotten another nice uplift in shares, so really over the past week, you’re up another about 6 and a half% over the past five trading days.
Taiwan Semiconductors Manufacturing ($TSM)
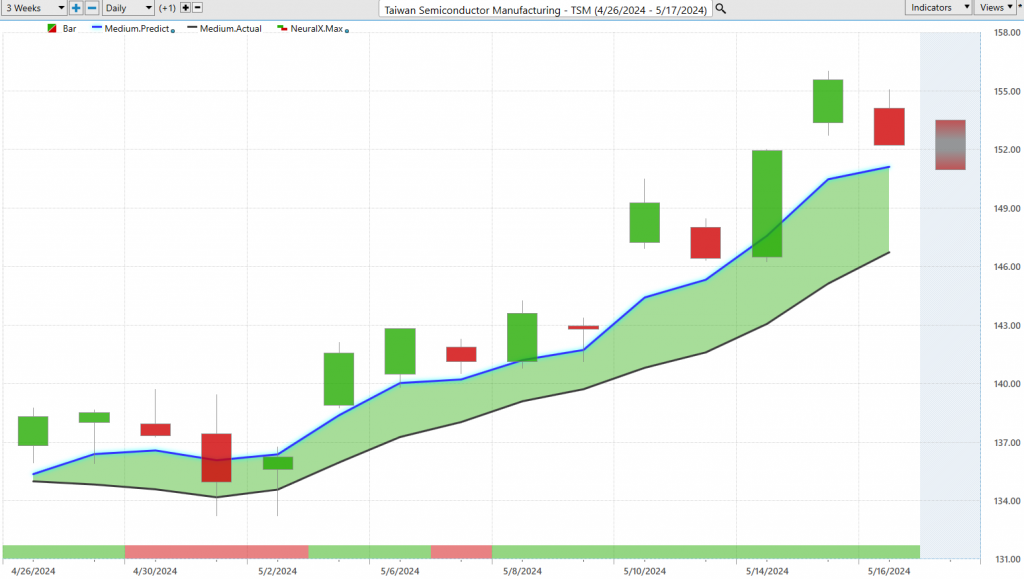
You also understand where and what area of the market to be focused in on, whether again that be the tech stocks here, the chip stocks, or Taiwan Semiconductor Manufacturing, again some of these biotech stocks, which we’ll go ahead and take a look at as well. So let’s take that same approach, and here we have TSM, and you see that again, we get this blue line over the black line crossover to that predicted moving average getting bullish. These are the types of signals that come through via VantagePoints intelliscan, so we can actually set all of these predictive indicators, whether we want to see a fresh cross, whether we want to see markets that are already in trend, whether we want to see that matching neural index and identify markets that really match our trading criteria. Again, we can look at those very short-term tools within VantagePoint, you see here again how the neural index goes bearish, you get a little bit of weakness, but as long as that blue line remains above the black line, the overall trend is up. And of course, we can look at those predicted highs and lows. So again, when we get that movement lower because we can, you know, tell that GFS, we haven’t moved lower yet, well sure enough, same thing in these other tech stocks, they need to go lower, and that’s where we start this advance. You see numerous opportunities here, predicted low, predicted low, predicted low, and then a very, very quick advance in the stock.
So really just this past week here, again, just through midweek, getting a 6% rally in shares of TSM just over the first part of the week here. So again, really nice opportunities here, playing out throughout the marketplace.
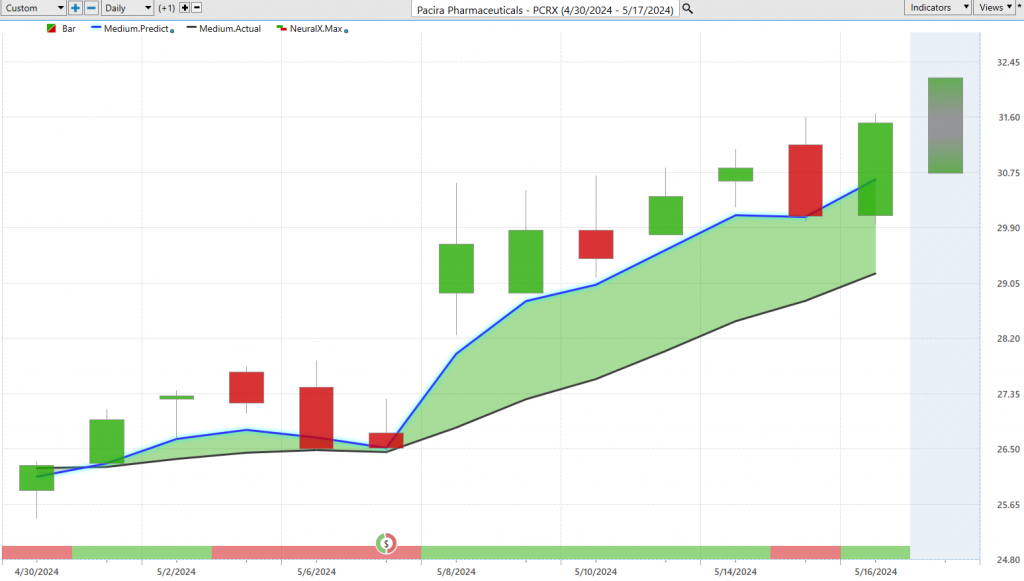
But here’s Pacira Pharmaceuticals. This is a market we actually looked at last week. We have a lot of noise around a lot of these biotech stocks around earnings, but again, let’s look at the most recent forecast over the last really five trading days since we’ve done the Hot Stocks Outlook. And we can look again at those predictive indicators. So here in Pacira Pharmaceuticals ($PCRX), you see, okay, well, this is last Friday right? So I make these videos in the morning before the markets open, and what is it highlighting? That okay, the overall trend is up, ideally, intraday what price levels do you want to look to accept? And you see, hit that predicted low, and even a couple of days ago hitting this predicted low, and then again marching higher as the overall trend resumes. But you know, this is a very strong move here, so you’re seeing just in the past you know five trading days here, market up 7.9%, and again highlighting that you know we had a few weeks where there was a lot of weakness, right? We’re highlighting Trip Advisor, areas where there’s just you know broad-based weakness in the market where you may want to just get out of the way, go to cash, and wait for exactly these types of opportunities coming through.
Here’s Pacira Pharmaceuticals. We can move over to a little bit more of a conservative stock.
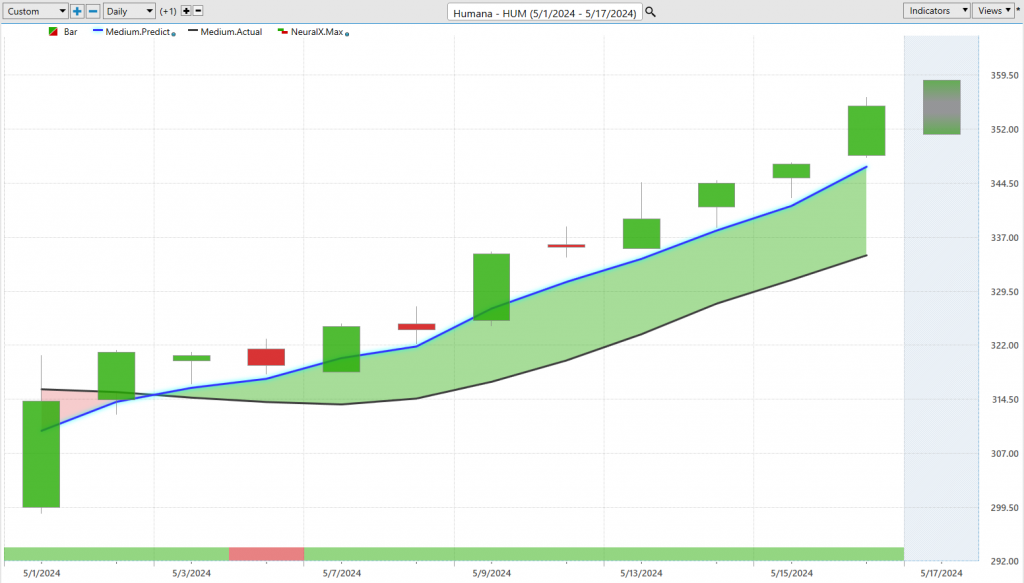
Here’s Humana ($HUM). Humana, a big healthcare provider, has seen a significant move in the market. With the blue line over the black, this is another one of those moves again just in the healthcare space that you identify and say, ‘Okay, well it looks like this market wants to go higher.’ You see just one blip on the neural index goes bearish, and then it’s pretty much all bullish as we just march higher day after day. Whether it’s United Health or Humana, you can take a look at a lot of these different forecasts from Vantage Point and get a sense of where that overall market strength is. You see this outperforming the past five days in the S&P 500, where we’re going higher—really nice moves, but nothing like these 15% and 11-12% moves you’re seeing just in a couple of weeks’ time in many of these stocks where we see those Vantage Point predictive forecasts get bullish.
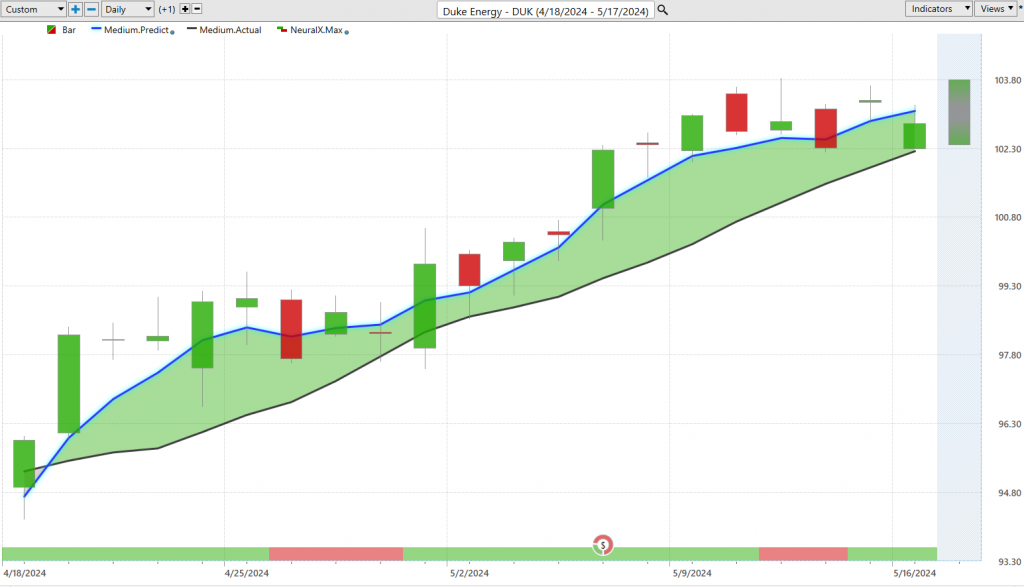
So, to that point on volatility, here’s Duke ($DUK), even a utility stock. Typically an area where you’re not going to get a whole lot of price movement, but we really brought this in for several weeks here and then broadly across the utility space, actually seeing a lot of strength via the individual shares but also the ETFs, like XLU. Vantage Point provides forecasts for and you can see that really broad-based sort of move coming through a whole sector of stocks. But we can again bring in those predicted highs and lows and again you see just this past week, getting this move down towards this predicted low, immediately moving up towards the range, and a lot of froth here. You see one of these days where all the bullish price action comes in here, you froth down to the predicted low, but still seeing again that strength from the neural index and the overall trend still very much to the bullish side. But you know, this is a utility stock which again usually don’t get huge moves here, but even here about a 7% move just over the past 20 trading days from where we started to see these bullish crossovers come through.
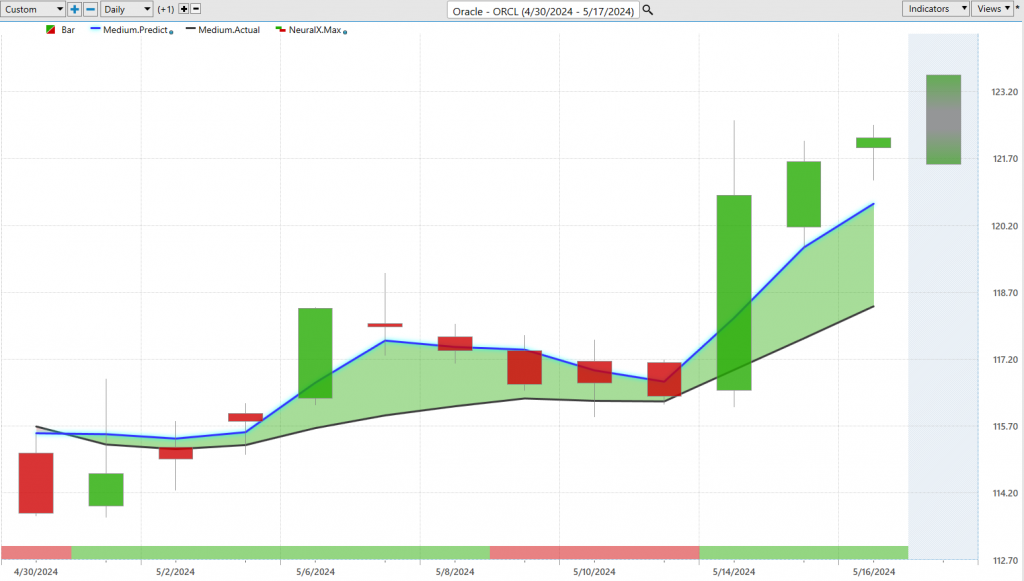
Lastly, here are shares of Oracle ($ORCL), another tech stock where again we’re starting to see certain things move around, again some very clear sort of strength in those biotech and chip stocks. But here’s Oracle, here again we get this blue line crossing above the black line, a really good example here of how the neural index works. The overall trend is up, the neural index is bullish—that’s a good entry for the start of a trade. But you’ll have these situations where you see the neural index goes bearish, so within an uptrend, you may get periods of consolidation. But as long as that blue line remains above the black line, the overall trend is up and you can keep expressing that trade. We see here again Oracle up about 6% over the past 11 trading days. We can look at those predicted highs and lows and again get that sense of well where’s this guidance moving through here if you want to be a buyer. Where do you want to target on the bullish side, where do you want to scale into the market? As far as getting lower lows, and you see capitalizing as we see again just broad-based strength come into shares and that benefit again more so these markets where we have these really nice setups, and we’re seeing things really start to move from really the end of last month and things start to accelerate again like these biotech and healthcare stocks.
So, we’ll go ahead and leave it there for today but once again, this has been our Hot Stocks Outlook for May 17th, 2024. Thank you all for watching, best of luck out there in the marketplace, and bye for now.


