


Register for a Free Live Training
The Hot Stocks Outlook uses VantagePoint’s market forecasts that are up to 87.4% accurate, demonstrating how traders can improve their timing and direction. In this week’s video, VantagePoint Software reviews forecasts for SPDR SPY($SPY), Docusign ($DOCU), Coherent ($COHR), Cummins ($CMI), BYD Company ($BYDDF), Arrowhead Pharmaceuticals ($ARWR), Hershey ($HSY)
SPDR SPY ETF ($SPY)
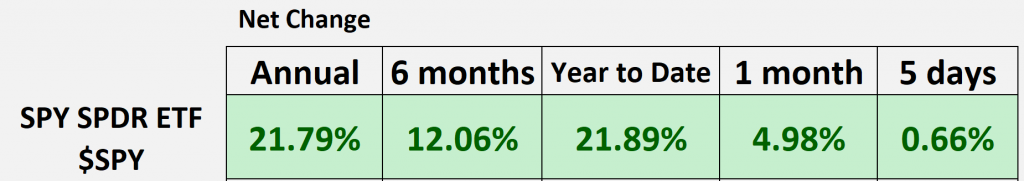
Hello again, traders, and welcome back to the Hot Stocks Outlook for October 11th, 2024. I hope you all have had an excellent week out there in the financial markets. As always, we’re going to take a look at the most recent Vantage Point AI predictive forecast. If you haven’t already, you can actually click on that link in the description below and get signed up for a live demonstration, so you can learn all the specifics about how these predictive technologies and indicators are helping traders make much better trading decisions out there in the marketplace. And so, we’re going to go ahead and start out with shares of DocuSign, Coherent, Cummins, BYD, Arrowhead, and lastly, Hershey. But as we typically do, we like to take a look at the S&P 500 just to get a broader sense of where things are at over these given periods of time. And so, we can see year-to-date we’re back up over 20%, almost 22%, after seeing some strength in the broader equity space. And the last 5 days we’ve been on a little bit of an uptrend here. So, really, a lot going on; there are some sectors doing well, some doing poorly. And this is where the Vantage Point predicted forecast can really help traders get the most out of those trading opportunities.
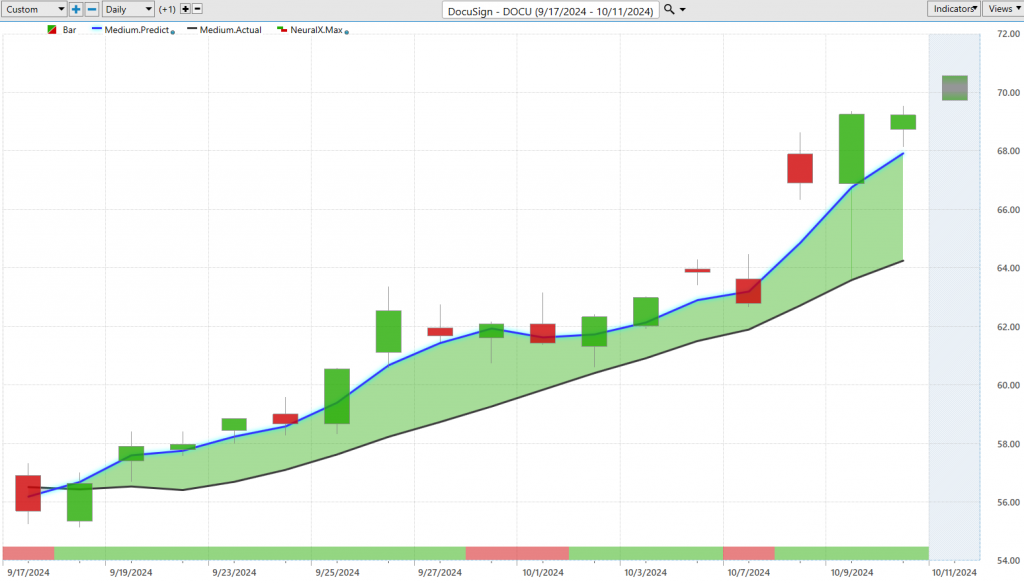
And so, DocuSign ($DOCU), we’ll start out here with shares of DocuSign, and this really acts as a good example of how all of these predictive indicators work together. And of course, how this works on these subsequent charts: we’re looking at the same indicators, the exact same way, every single week. And so, what we have here is daily price action, right? So each single candle will represent a full and complete trading day, and right up against all that price data, really, the first thing that stands out there is that there is a black line and also a blue line value. So the black line value that you see there, well, that’s a simple moving average. So this is a very common technical analysis tool, and in this case, it’s a 10-period simple moving average. So that would look back at the previous 10 closes, add them all together, and then divide by 10. But really, the weakness with indicators like this is that all of the data comes from the past, and in addition to it lagging and really just summarizing what’s already occurred in the market, is it only looks at one market in isolation, as if DocuSign isn’t affected by other stocks, it isn’t affected by the S&P 500 and the NASDAQ. But what’s important is we understand that these relationships actually do affect each other. And so rather than looking at rearward-looking indicators and lagging tools, what Vantage Point is able to produce is a proprietary predicted moving average. And for this number, which you can think of as a prediction of future prices, well, for that to get calculated and plotted every evening for the trader, well, this is where the technology of artificial neural networks perform what we would call intermarket analysis. And so, there are dozens of markets that are known to drive and influence the future price of shares of DocuSign. And again, this can be things like the S&P 500, the NASDAQ, and even individual stocks, whether they be positive, inverse correlations, leading, and lagging relationships, but it doesn’t stop there, right? So Vantage Point’s able to look at very important markets like currencies, like the value of the dollar index, global interest rates, even things like gold or silver or soybeans if it’s relevant to that target market that you’re trading. So what the software is able to do is look at all these competing relationships and it uses that data, that’s essentially the dataset used to generate these highly accurate predictive forecasts. But of course, we want to say, okay, what are we predicting? Well, that’s where our Vantage Point predicted moving average does a good job of letting us know when these trends shift. So whenever that blue line crosses above the black line, well, it’s suggesting average prices here are going to start moving higher. May want to go ahead and take long positions and take profit on those longs, right? Really be in buy mode here. And so we see, since that blue line crossed above the black line, we have over a 20% rally in just the past 16 trading days. So really nice move in this space. But of course, we can use these other predictive indicators, whether that be our neural index, you see at the very bottom of the chart, this green and red line, or the predicted high and low range to really round out the entirety of this forecast and help traders execute their strategies most efficiently.
And so, as we look down at that predicted neural index, this indicator here is tuned to solve a different problem, and that’s short-term strength or weakness over the next 48 hours. So you can think of that as really just a couple of trading candles at a time. And you’ll notice that when the neural index goes bearish, well, we actually get a couple of days of sideways consolidation. Once it gets back bullish again, you start to see that momentum kick up into the market. And so this indicator has upwards of 80-plus% accuracy across a very wide number of markets, and that’s what traders, again in the short term, are using to make those determinations, where they want to be buying, adding to their positions, or potentially short-term trading. And so, really, to round this out, we of course every week look at those predicted highs and lows, and this is where things get really exciting intraday for traders, as you have really an entire roadmap of, you know, what’s the overall trend direction, should you expect some short-term strength over the next 48 hours, and what is that daily range going to look like? So as we look back at these previous ranges against the prediction, what we can see going into this move, it’s telling you, look down towards these predicted lows to be accumulating a position. And you see, pretty much as soon as you accumulate a position, the next trading day or two, you’re getting that resumption of the rally and trend, uh, and the market really not pushing against you much at all here. So really nice move there, upwards of a 20% rally here in DocuSign, and just a good example again of how all of these predictive indicators work together, as you see that strength come through the forecast. Well, that’s where we really see that momentum pick up, uh, and traders can again execute those strategies.
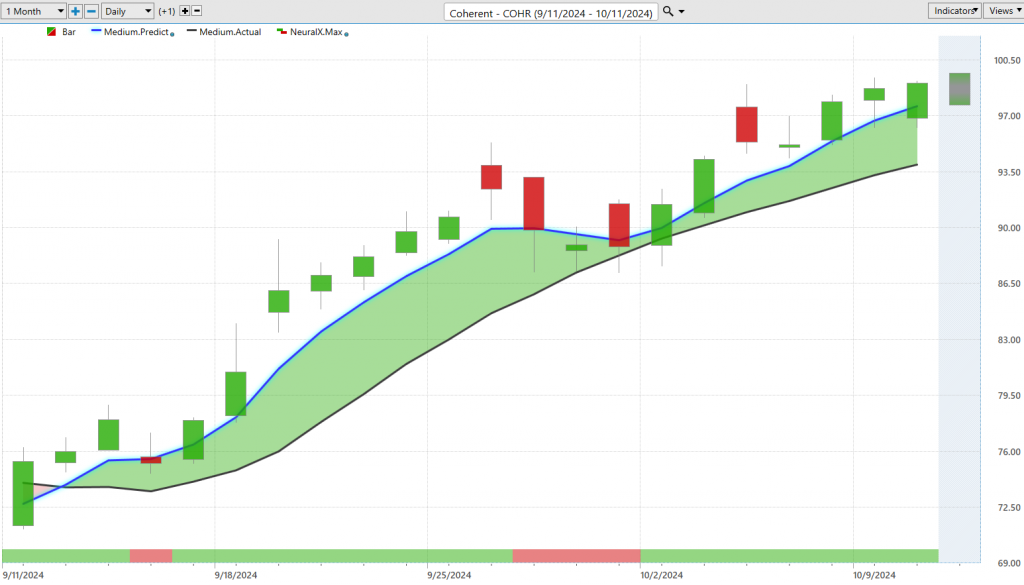
Here, here’s Coherent ($COHR), another good example here of this blue line crossing above the black line. You notice we get a little blip with the neural index; it immediately resolves itself, moves to the bullish side, you get a little bit of a consolidation here with the neural index, a couple of days of sideways. But again, as that neural index, and the overall trend, is up, well, that’s where we really see momentum kick back into the market. And so we had a really nice move here, very similarly, over the past month of time here, about 21 trading days, almost exactly there, um, about a 31, almost 32% rally. But of course, we can look at those predicted high and low ranges and say, okay, well, if you’re a trader in the market here, where might you be looking to accumulate a position? And this is very interesting; we actually see this all the time, and I want to just highlight it because sometimes, even when the software looks like it’s inaccurate, right here, we’re coming out of the range. We actually see this all the time, especially around weekends here where, um, the all the price action is bullish here. You see on this trading day, and you have this previous predicted low which we can actually see was at about, uh, 7470, let’s call it, uh, and the market moves down to 7460, the next trading day, and immediately goes up into that uptrend. So when you have these levels on the chart, you’re really aware of them. We can set up that game plan, really understand what’s going on, and where that market is, again, likely to pick up some steam here. Uh, so again, we see that rally pick up; you get some more consolidation, pull back towards those predicted lows, but again, really nice area to get reinol or potentially use the profits from the per first part of the move to add to the position. And so again, we see more recently, uh, neural index uh being very bullish here again, these predicted lows acting at great levels. I mean, even here yesterday, the market moving down and immediately trading higher, and very likely to move up towards these predicted highs, uh, for a couple of percent move there just over the past couple of days there in Coherent. So again, really nice opportunities really spread out throughout the marketplace here, um, here’s shares of Cummins ($CMI). Cummins again, our blue line, uh, predicted moving average crossing above the black line, uh, neural index very bullish throughout here. We got a couple of blips here where we come down to, uh, that red configuration, you get a little bit of a sideways price action, but overall here I mean a lot of separation between that predicted moving average and the actual, suggesting that this is actually a very strong trend here.
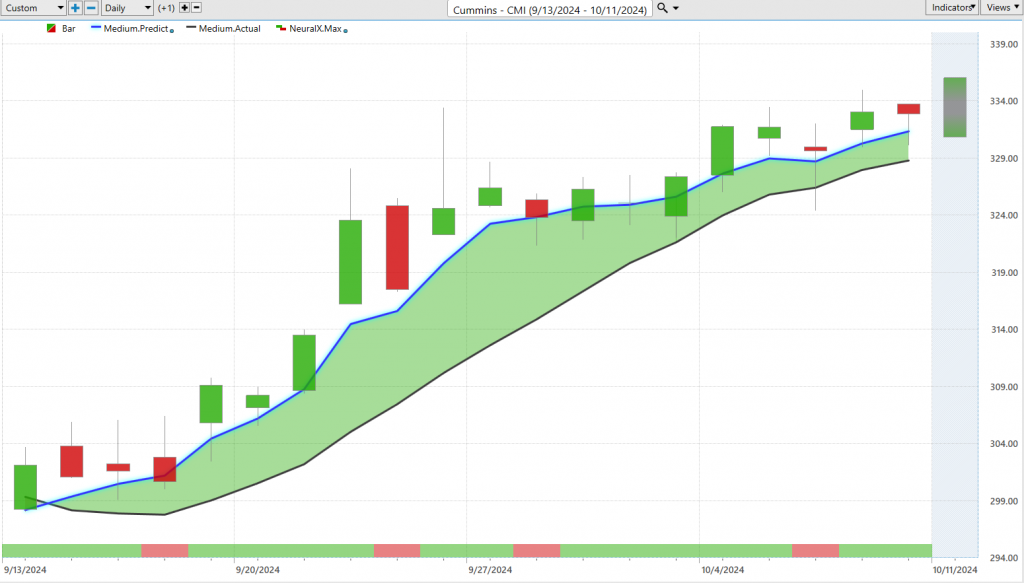
So, uh, as we look at Cummins and look very closely at these predicted highs and lows, you again see that, you know, even when you start getting all this volatility, especially around weekends, you’re going to have these predicted levels letting you know, look, be aware of these levels, we may trade down there, you wouldn’t want stops sitting in there, but also be ready to accumulate as we move down. And you just see, what is this, 1, 2, 3, 4, five, six, seven days in a row, uh, where the market moves to that predicted low and pretty much immediately closes higher by the end of the day before resuming its uptrend there. So really nice moves there in shares of Cummins. Again, we can take a look at the overall move here, over the past month here, about a 10, almost 11% rally here in the past 19 trading days.
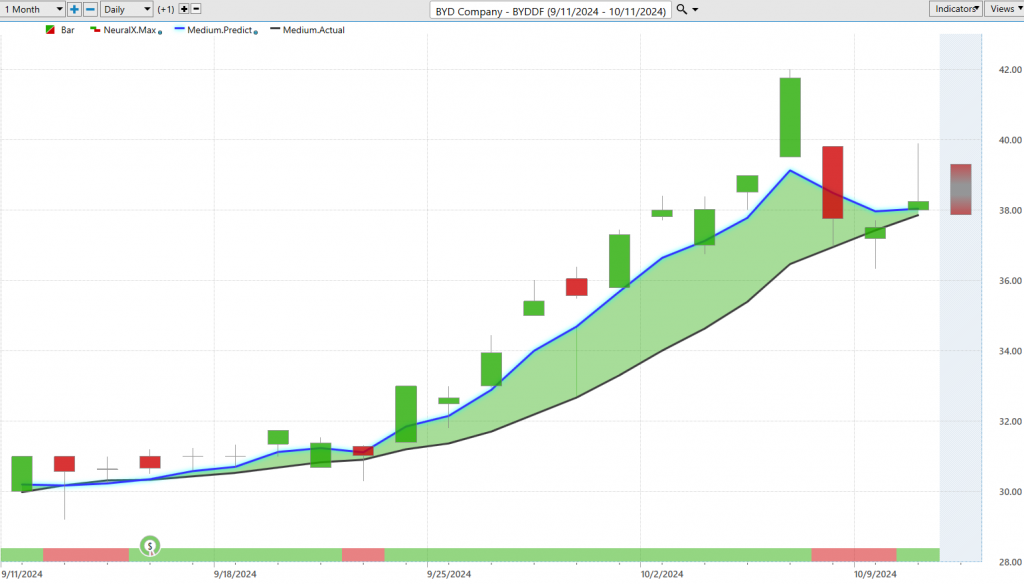
Um, now we talked a lot about the Chinese stock, so it was actually Las Vegas sand. BYD Company ($BYDDF) does a lot of business in China, um, here we have BYD, really similar example here where we see that blue line crossing above the black line. Uh, Wynn Resorts, that was the other, uh, you know, resort operator, um, that had come through as well. Uh, but here we see BYD, with a lot of the Chinese stocks, Bu was another one we looked at, blue line crossing above the black line, neural index very bullish here for the resumption of this move here. So when you actually look at this, and we say, okay, well that neural index has accuracy, upwards of 80-plus% accuracy, well, this is what it’s talking about, is we notice that how many days here that neural index is bullish. Well, let’s actually just go ahead and take a look at it, right? So we have this really nice rally here, the market moves up 35% over 16 trading days, and 15 out of the 16 of those days, that neural index is reading bullish, and that’s where that accuracy comes from, consistently very high levels of accuracy for the short term. Uh, and of course, traders can combine this with their other analysis and say, okay, well, what’s the most logical thing to do here? Should we expect momentum, uh, and of course, we can adapt with those predictive indicators as things change. So again, you get a lot of volatility, you really see things starting to shake around, uh, but just managing that opportunity, of course, recognizing at the right time to make the most of that. So, you know, whether you’re getting in early or getting in a little later with the help of these predicted highs and lows, you know, making sure you get a good piece of the move there, uh, in about a 25, 28% rally there over a short period of time.
Arrowhead Pharmaceuticals ($ARWR)
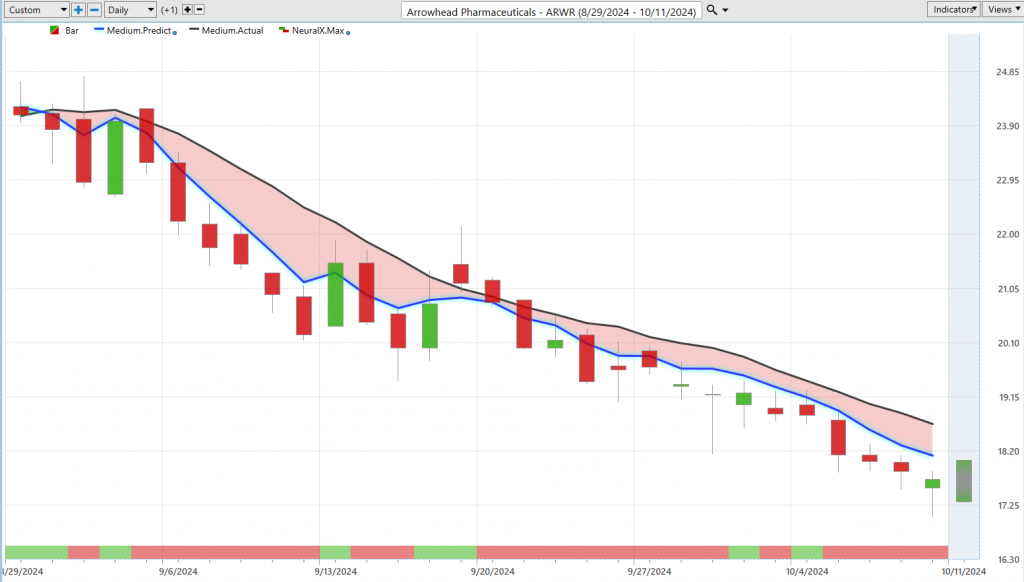
Uh, now I wanted to just pivot over to Arrowhead Pharmaceuticals ($ARWR), to some bearish opportunities because what’s important to understand is that this works the same way, whether you’re on the bullish side or the bearish side, right? Whether you want to you may hedge some bullish opportunities, maybe you just want to go short. Um, but here we see Arrowhead Pharmaceuticals, and this is actually interesting, we see the neural index actually bullish as we get this crossover to the downside, but you’ll notice that you’re getting higher highs, the market closes higher actually 48 hours later, has a gap up on the third trading day, but as that bearish momentum comes in from the neural index, we really see things start to move lower, uh, and the overall trend, uh, revert to the downside here. Uh, you get these consolidations where again the neural index bounces up, and we get a couple of days of strength, but overall, very, very weak here. And as we look at those predicted highs and lows against the actual data, well, of course, we see an even tighter roadmap of where should we expect weakness to set in here, uh, and of course, this has been a very, very weak market here over the past couple of months, where we’ve really seen broad-based strength here, uh, in some of these bigger names. So Arrowhead down about 26, almost 27%, just over the past 209 trading days.
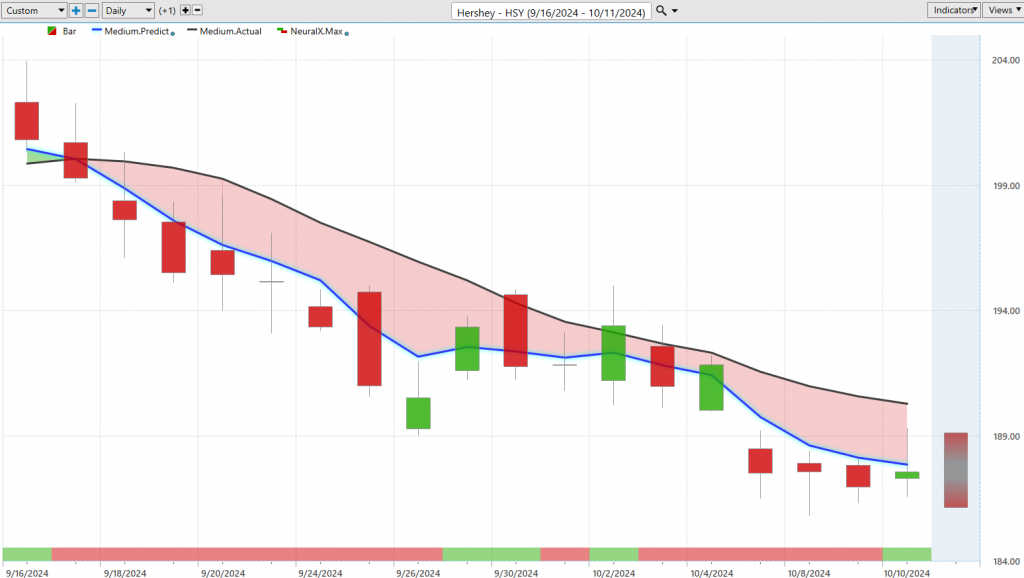
Uh, here shares of Hershey ($HSY), so again, just as an example of, well, where do we not want our attention on the bullish side? Well, here you see Hershey, blue line crossing below the black line, neural index is very bearish in here. We get a little sideways consolidation, right? So even back here, it’s telling you, look, for the next couple of trading days, things to be bullish. And of course, strength, strength, but the overall trend, very weak. So when you can combine those and understand, hey, let’s actually use this strength, potentially to get short, maybe hedge with some options, knowing that this is not an area where you want to be on the bullish side, uh, and um, you know, again, really nice opportunity here as shares slide a little bit lower here, just about a 5% move over the past 17 trading days. But a good example of, you know, where you really don’t want your attention over the past 17 trading days, as we see some of these markets actually do really, really well, uh, and get into some nice rallies.
So, uh, we’ll go ahead and leave it there for today, but once again, this has been the Hot Stocks Outlook for October 11th, 2024. Thank you all for watching, best of luck out there, and bye for now.


