Register for a Free Live Training
The Hot Stocks Outlook uses VantagePoint’s market forecasts that are up to 87.4% accurate, demonstrating how traders can improve their timing and direction. In this week’s video, VantagePoint Software reviews forecasts for SPDR SPY($SPY), Microstrategy ($MSTR), Apple ($AAPL), TESLA($TSLA), META ($META), Oracle ($ORCL), Trump Media and Technology Group ($DJT),
SPDR SPY ETF ($SPY)
VantagePoint A.I. Hot Stocks Outlook for October 19, 2024
Hello again, traders, and welcome back to the Hot Stocks Outlook for October 19th, 2024. Of course, I hope you all have had a great week out there in the financial markets, and as always, we’re going to take a look at the most recent VantagePoint A.I. predictive forecast. So, if you haven’t already, you can go ahead and click on the link down in the description below and get yourself signed up for a live demonstration, so you can learn more about how these predictive tools are helping traders make much better trading decisions out there in the marketplace.
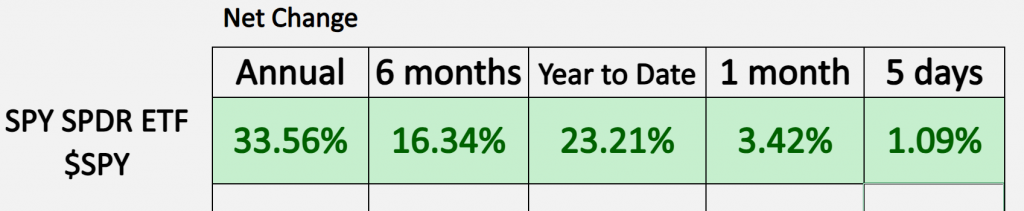
And so, as we typically do, we like to start out here looking at the S&P 500 just to get that broad sense of where the market has been over these given periods of time. And so, uh, we can see we had another good week last week here with the last five trading days; markets grinding higher, uh, throughout the year, now moving above that 23% marker. And again, in the last quarter end of the year, going into the elections, and markets just keep grinding higher, uh. But, of course, when we look at individual stocks, well, we want to be careful and really identify the best opportunities out there.
And so, it’s really good examples here of how all of these predictive indicators and tools work together, then traders can really fit that into their strategies and approaches to trading the markets.
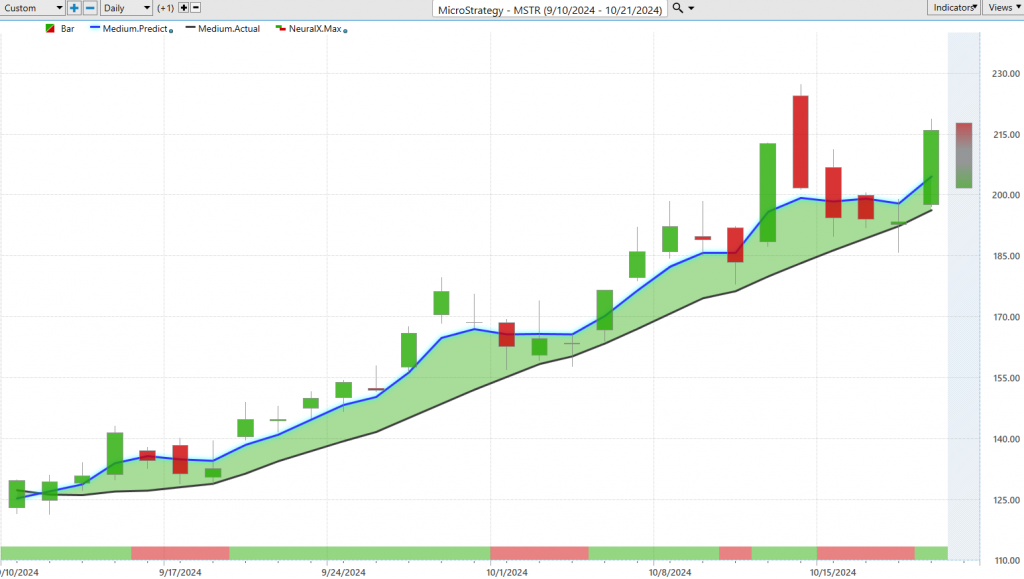
And so, we’ll take a look here at shares of MicroStrategy ($MSTR); MicroStrategy, it’s a really good example of how all of this works. So, uh, what you’re seeing here is daily price action, right? So, that means every single one of these candles is that’s going to represent a full and complete trading day. And the first thing that’s going to stand out here is right up against that price data, you’re going to notice that there is a black line and also a blue line value. So, the black line that you’re seeing there is actually a simple moving average. So, if you’re familiar with technical analysis, this is a very common technical analysis tool. Uh, in this case, it’s a 10-period, so it looks back at the previous 10 closes, adds them all together, and then divides by 10. But one of the problems with tools like this is they really just summarize what’s already occurred in the market because all those data from the previous 10 days, well, it’s already occurred. And the other weakness here is that it’s only looking at one market in isolation. And this may be a very good example of how markets don’t really move in isolation, right? Other markets can drive and influence the future price of, in this case, MicroStrategy. And so, what the software is able to do is look at in-market relationships that are pushing and driving those future price movements.
And so, what we want to do is compare that black, what we might call a lagging, simple moving average to this proprietary predicted moving average. And for this number, essentially a prediction of future prices, for that to get calculated and plotted on the chart every evening, well, this is where the technology of artificial neural networks comes in. And what they’re doing is they’re performing, again, what we would call intermarket analysis and looking at how well, what other markets are potentially driving and influencing the future price of MicroStrategy. Well, for most stocks, that can be important things like, uh, the S&P 500 or the NASDAQ. In MicroStrategy, that may be some other very important markets like Bitcoin, uh, as well as the value of the US dollar, interest rates, or potentially even gold prices. So, it really takes this global approach, looking at cryptocurrencies, potentially looking at, uh, major commodities, looking at individual stocks, looking at ETFs, but only the ones that are specifically applicable to giving us an edge on where future prices are headed.
And so, whenever we see that blue line cross above the black line, well, it’s suggesting that average prices here are going to start moving higher. A trader can then look to take a long position, which would be the most logical, based off of this output. And we see that over the past 28 trading days, since that predicted moving average crosses above the actual, got a 67% advance in shares of MicroStrategy. And last week, we saw Bitcoin do pretty well as well. And so, what traders are able to do is understand where a lot of these markets are starting to turn through the help of the IntelliScan feature, and this actually allows traders to utilize these predictive indicators to their liking and really fine-tune and leverage these tools to really execute their strategies, uh, exceptionally well.
So, uh, what we have here at the very bottom of the chart, though, uh, is you notice that there’s also a green and a red line here, right? It’ll flip from green back to red, back to green. This indicator here is also utilizing that inner-market analysis approach and utilizing those neural networks but they’re tuned to solve a different problem here. They’re not looking at the overall trend like our predicted moving average; they’re just forecasting very short-term strength or weakness over the next 48 hours. And so, what you’ll notice is that we have these periods where the neural index may go bearish, and we get subsequent price weakness, and traders certainly want to be prepared for that if they’re trading very short-term. But notice that that blue line still has quite a bit of distance above that black line, and the overall trend is up. Here, it happens again; we get some weakness over the subsequent trading days here; you see that we actually get no weakness; the market continues higher here, a couple of trading days of weakness, but overall, you get an extremely accurate indicator, uh, with this predicted neural index at the bottoms, upwards of over 80% on a very wide number of markets. And so, this allows short-term traders to really understand where that momentum is coming in and really leverage that, uh, to their benefit.
And lastly, well, every single week, we take a look at these VantagePoint predicted highs and lows, so before every trading day, you’re provided a predicted range of where the market is likely to trade. And so, what we do here is we take a look at all of those predictions against the actual trading market data, and so you see, really at the beginning of this trend, you’re getting excellent levels to establish a longer-term position, even during this consolidation moving down to that predicted low, and within 48 hours, we’re seeing the market perk up and start to go higher. So, really nice opportunities, even here last week, to buy down on some of these dips and seeing Friday a really nice advance in prices. And so, this works on any market that you might be trading in, really the same way, whether you’re a trend trader, uh, whether, again, you’re doing that short-term trading or even intraday day trading with the help of those predicted highs and lows. So, really nice move here in MicroStrategy, and also Bitcoin.
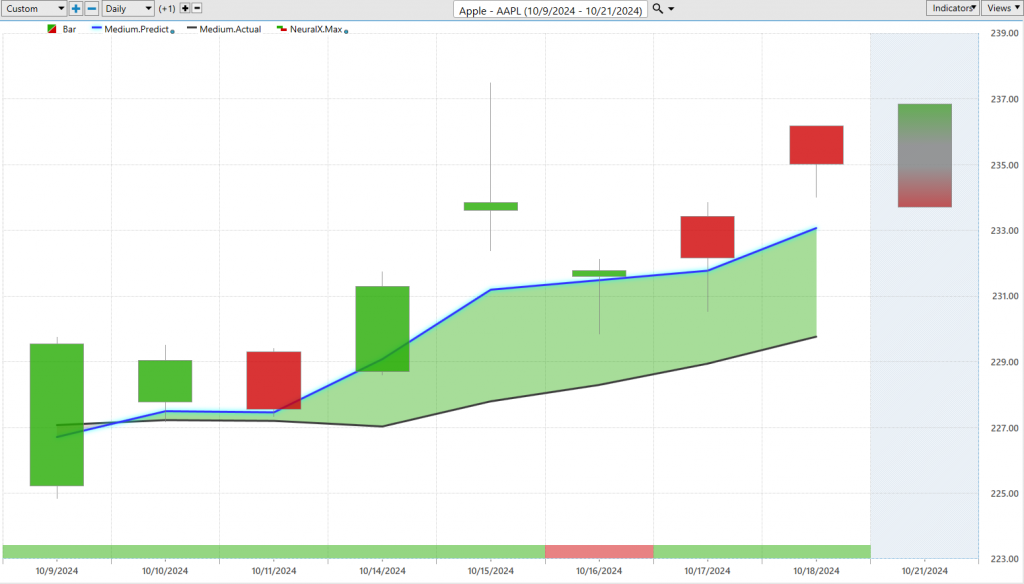
But let’s go over to a more recent opportunity here in Apple ($AAPL). Last week, Apple has a really nice advance, but this really started toward, uh, you see on the 10th here, on October 10th, we get this Blue Line crossing above the black line; the neural index is really very bullish throughout this period except for this one trading day here, where it’s just warning that, okay, well, we may get some weakness, but look at the separation here between this predicted moving average and the actual moving average. So, a lot of strength within the overall trend, and, of course, again, we can look at those predicted highs and lows and really pick out these exceptional levels here to get involved in that trend early, down at around 227, 228. We often see things like this, uh, every week when we look at the Hot Stocks Outlook, and we see that we get all this bullish price action, and what happens? Well, we still have these levels from the previous predicted low, and sure enough, that volatility goes very closely, about 20 cents off of the predicted low, and then the resumption of that uptrend there.
So, uh, these levels really provide traders the guidance to say, okay, well, what should I be prepared for? What level should I be paying attention to? When we get those snapbacks to those expected levels, well, that’s where VantagePoint traders are really ahead of the game and prepared for things. So, uh, really nice advance here in shares of Apple over the last week, up about 3 and a half percent, but all of these big tech stocks are not moving in unison.
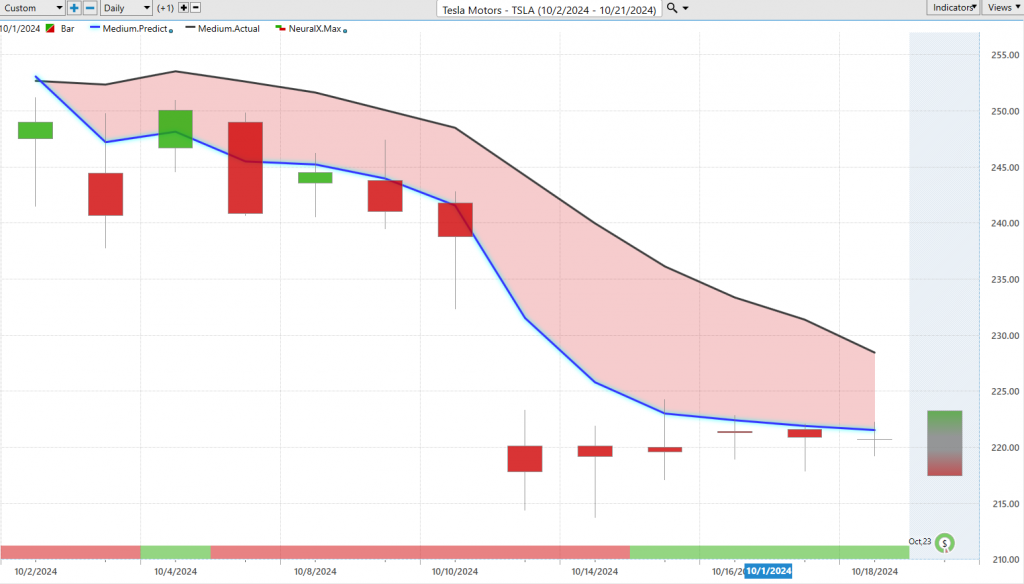
We can take a look at Tesla Motors ($TSLA), which is going to have earnings next week, so this may act as a catalyst, uh, really propel the stock, uh, but currently, we see over the past couple of weeks this blue line very solidly below the black line, uh, neural index very bearish here as we got this really big gap down and aggressive movement lower. Now we’ve seen prices go sideways, going into earnings, and so that’s where things get a little, uh, random here as far as you’re going to have a big catalyst that’ll propel prices, but you notice that since this neural index gets bullish, just sort of creeped higher and runs sideways, no longer on the decline, uh, but the market still is over in a, you know, overall downtrend. We can look at those predicted highs and lows, uh, and
again, offering some really good levels that say, okay, look towards these predicted highs to short, especially if you’re doing some, uh, short-term trading here, uh, and certainly getting on the right side of the market and really not a place if you’re a, you know, bullish trader, uh, where you’re going to be looking to take long positions. And we see over the past couple of weeks, you got about almost a 12% decline here in just the past 11 trading days, uh, Meta Platforms ($META), a really interesting example of both sides of this.
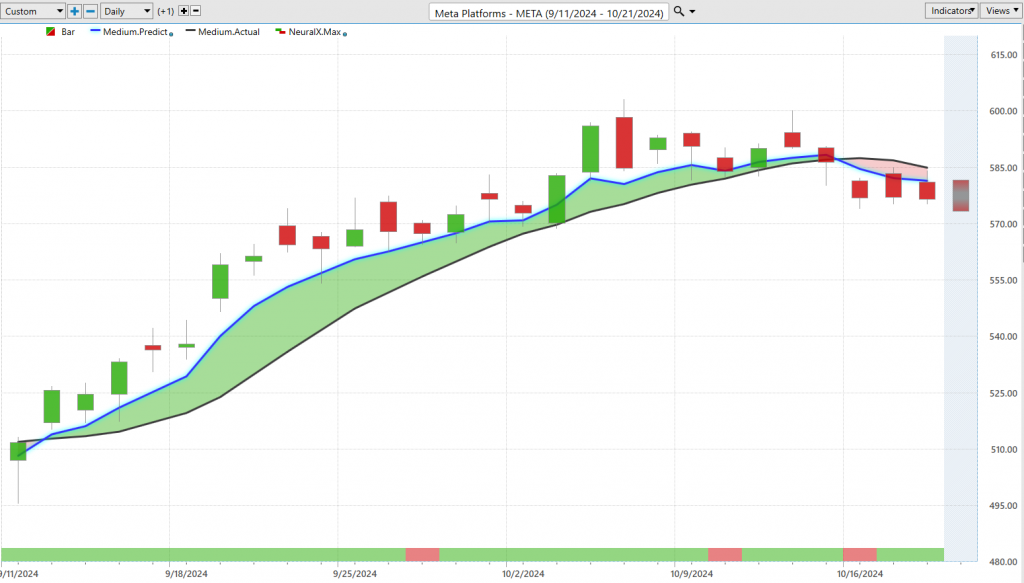
So, Meta’s gotten a lot of attention; they’re doing a lot of interesting things, uh, but here we see this Blue Line crossing above the black line. Look at this neural index for the duration of this move; I mean, really throughout this entire, uh, trend here, it’s been quite bullish for the duration, only 3 days where that neural index actually went bearish. But take a look at this predicted moving average, right? It’s really highlighting that this is where the trend really gets started on the bullish side. Uh, we can look at those VantagePoint predicted highs and predicted lows, and much like these other opportunities, excellent entries at the beginning of this move and often opportunities to add to that positioning as the markets do well and really give you that cushion to do that trading. But when you see those shifts in the marketplace, and here we see, uh, that Blue Line crossing below the black line, and sure enough, the next trading day, if we look at these VantagePoint predicted highs, well, that’s where the market starts to go lower. And so, traders can understand that, look, this is really a dangerous zone to be long; you’re on the bear side of the trend, go ahead, take some profit, maybe do a little bit of trading there, uh, maybe do some hedging if you want to remain on the bullish side, uh, but really nice again, opportunity here where we see in shares of Meta, uh, really see a nice advance here. If we look from where those crossovers came through to really the peak here, get about a 16% rally over 17 trading days there in shares of Meta.
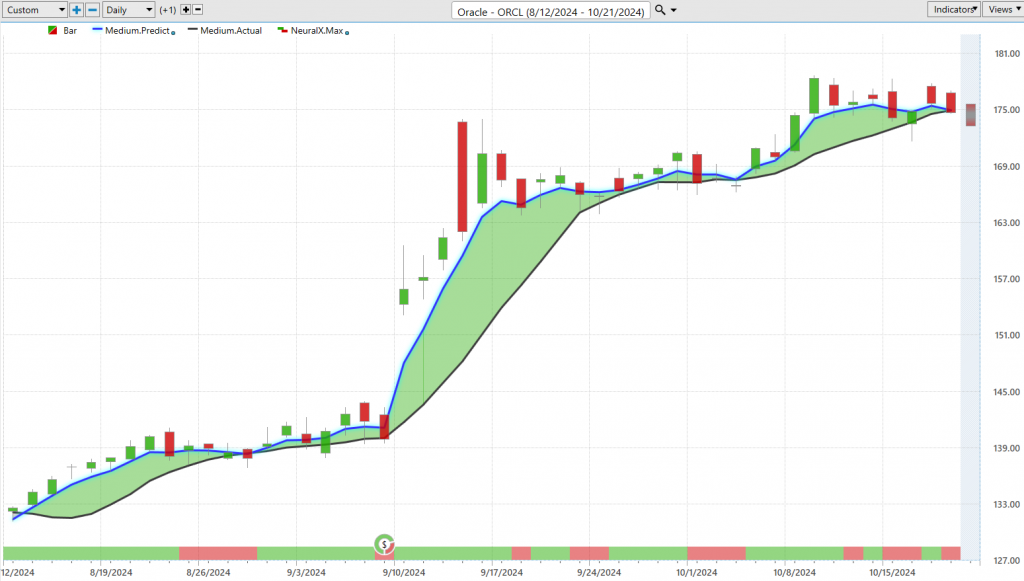
Now, Oracle ($ORCL) is another stock that’s done really well, uh, likely to benefit from all these AI advancements across really the corporate space here, uh, but here we see Oracle and really a very bullish forecast from the duration, going all the way back to mid-August here. So, uh, if this is on your radar and traders can use these short-term predictive tools to, again, day trade, maybe trade some options, maybe do some trading, uh, you know, around earnings, but really what I wanted to highlight here is we see this trend gets on the bullish side, we get really close to a crossover here, but, you know, very quickly remaining very bullish, uh, and what I want to highlight here is just the adaptive qualities here. So, we get this big push on earnings, and we can see, you know, predicted highs and lows doing a really great job leading up to that event, but just like in most times, you know, earnings are going to act as a catalyst, and the software is doing this very, uh, uh, routine analysis where it’s going to constantly look at very short-term, uh, weigh in the variables that are important regarding those intermarket relationships and how they play on the stock price day-to-day. Well, earnings is sort of a random event; there’s some new data coming in, no one knows the data, and we often get really big moves, uh, that oftentimes move in the direction of those VantagePoint predictive trends, but notice how quickly the software gets back on track, right? Tons of volatility but doing a great job with these subsequent predicted highs and lows and saying, okay, well, if you want to trade this market, what can we expect? Where are the changes and shifting in the trend happening, and how can the trader go ahead and manage that? But overall here, this has been an extremely bullish forecast; you see these, uh, predicted high or VantagePoint, uh, predicted moving average level starting to narrow, uh, but still there on the bullish side here.
Trump Media and Technology Group ($DJT)
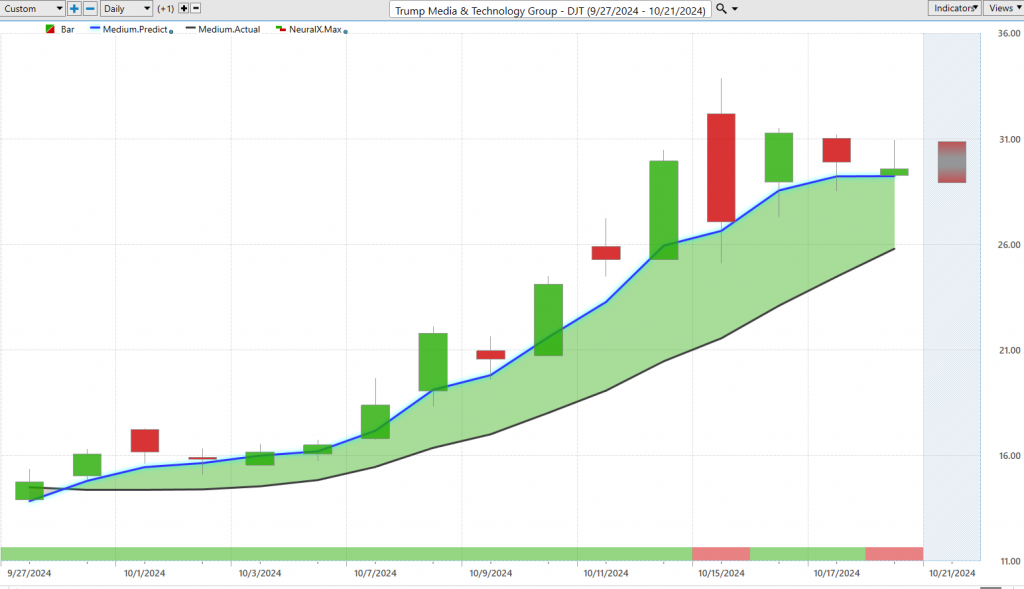
And, uh, lastly, with, you know, election season coming up, a lot of volatility, a lot of sort of meme magic, Trump Media & Technology Group ($DJT) going on out there, and people getting really excited about, uh, certain changes and things. And so, here’s Trump Media, and so we had a blue line cross above the black line, neural index EXT, extremely bullish, uh, through this move here, and this has been a pretty exciting advance as we see people getting excited about the news and things shifting around here, and, uh, now we’re currently in an environment where stocks can really aggressively move, right? And so, uh, here we see this Blue Line crossing above the black line, neural index bullish, and look at these predicted highs and lows, so really indicating that, look, if you want to get involved here, look down towards these predicted lows, and even with all this volatility, really acting as an excellent guide to do some trading, uh, and get some positioning on the bullish side here as we see, uh, these shares go up, uh, pretty good degree here, right? We have MicroStrategy up big, uh, here, an 87% rally in 14 trading days. So, some really exciting opportunities, a lot of noise out there in the markets, but this is why it’s so important to really have that guide, minimize the risk, uh, and help yourself make much better trading decisions based off really this statistical analysis and these high probabilities, uh, driven out by these neural network relationships.
So, uh, once again, this has been our Hot Stocks Outlook for October 19th, 2024. Thank you all for watching, best of luck out there, and bye for now.