Register for a Free Live Training
The Hot Stocks Outlook uses VantagePoint’s market forecasts that are up to 87.4% accurate, demonstrating how traders can improve their timing and direction. In this week’s video, VantagePoint Software reviews forecasts for SPDR SPY($SPY), Meta Platforms ($META), Baidu.com ($BIDU), Phillips 66 ($PSX), Cameco ($CCJ), Wynn Resorts ($WYNN)
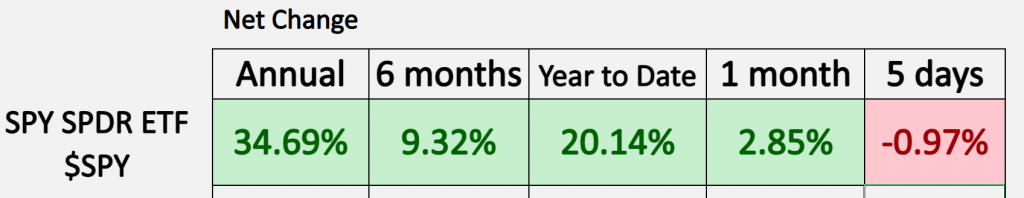
SPDR SPY ETF ($SPY)
VantagePoint A.I. Hot Stocks Outlook for October 4, 2024
Hello again, traders, and welcome back to the Hot Stocks Outlook for October 4, 2024. Hope you all have had an excellent week out there in the financial markets, and as always, today we’re going to take a look at the most recent VantagePoint A.I. predictive forecast. If you haven’t already, you can actually go ahead and click on the link in the description below and get signed up for a live demonstration to learn all the specifics about how these predictive technologies are helping traders make better trading decisions out there in the marketplace.
Now, as we typically do, we like to start out with the S&P 500, SPY SPDR ETF ($SPY). The main point here is that year-to-date, we’re up over 20%. We’ve seen a little volatility pick up in the marketplace, so what we can do here is utilize these predictive indicators to identify some decent trading opportunities.
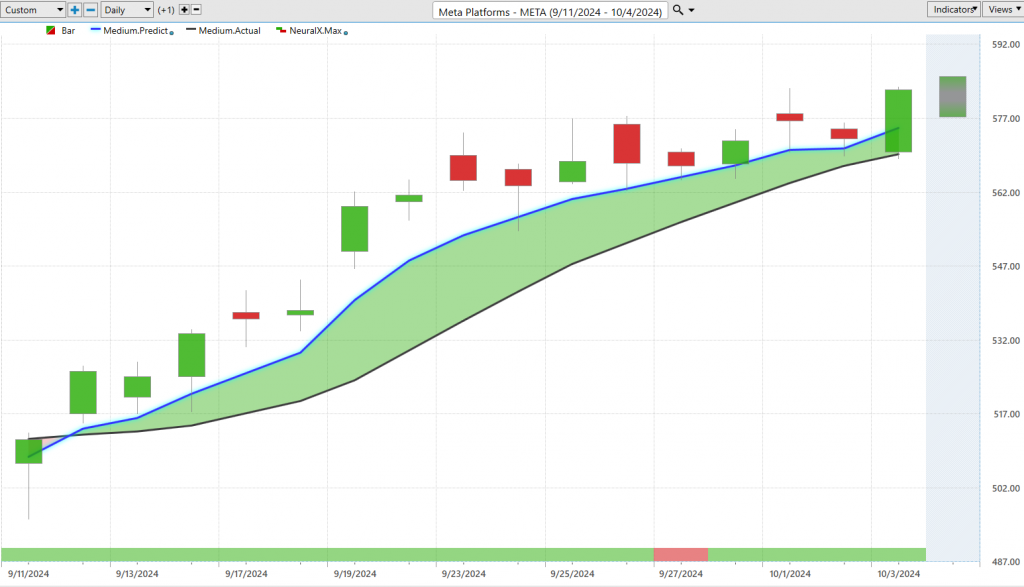
The first opportunity here we can look at is Meta Platforms ($META). It’s a really good example of how all of these predictive indicators work together.
So, what you’re seeing here is daily price action; each one of the candles is going to represent a full and complete trading day. The first thing that should stand out is right up against all that price data, you have a black line and a blue line value. Now, the black line that you’re seeing there, that is actually a simple moving average, a very common technical analysis indicator. In this case, it’s a 10-period, so it would look back at the previous 10 close prices, add those all together, and then divide by that number. But really, the weakness with technical analysis tools like this is that all the data comes from the past, so it’s really just summarizing what’s already occurred. It also only looks at one market at a time, in this case, Meta.
Now, what Vantage Point traders are able to do is compare essentially that baseline value, we can compare that to this proprietary predicted moving average. For this calculation, essentially a prediction of future prices, for that to get calculated and plotted on the chart, well, this is where the technology of artificial neural networks come into play and are performing what we would call intermarket analysis. So, what we’re able to understand is that other markets are known to drive and influence the future price moves in Meta. Now, this can be a collection of individual stocks, this can be some of those large indices like the S&P 500 or the Q’s, but this can be things like global commodities or currencies like the value of the dollar index, interest rates, um, and so it’s taking this global approach, looking at all the relevant markets that are known to affect the target market that you’re trading, and it uses that information to generate highly accurate predictive indicators. So, whenever we see this blue line cross above the black line, well, it’s suggesting average prices are going to start moving higher. You might want to look to go ahead and take a long position.
And so, you’ve seen since that time, we’ve had about a 12 and a half percent rally just over the past 15 trading days here in shares of Meta, so a really nice move. But that’s not really the entirety of the forecast because we have these other predictive indicators that can help traders really get more out of this. So, what you see at the very bottom of the chart here is what we call the Vantage Point predicted neural index, and this has a very high level of accuracy but it’s only forecasting ahead 48 hours; it’s a very short-term indicator, uh, just short-term strength or weakness in the market, and this is what traders are utilizing to understand when momentum and short-term opportunities are picking up in the marketplace, in addition to the predicted high and predicted low range. So, each week in these weekly stocks or hot stocks outlooks, we take a look at these predicted ranges and say, okay well if you had this information that says, okay well we’ve seen a cross over to the bullish side in Meta, well every single day you’re getting these levels before the trading day occurs, and this is what allows traders to get excellent entries into the market and manage their opportunities more effectively. So, you see about five entries here, getting really close even yesterday before that big uplift and allowing traders to do extremely well, and you’ll also notice that as the market moved higher here for what looks to be almost 15 or so trading days, there’s only one day where the market goes bearish, and you get a subsequent really sideways price action before it very quickly flips back to bullish, and we see that momentum pick up.
So, this again is what’s helping traders make these better trading decisions, uh, and capitalize not only on this 12%, but potentially adding to the position at the right time to make the most of that opportunity,
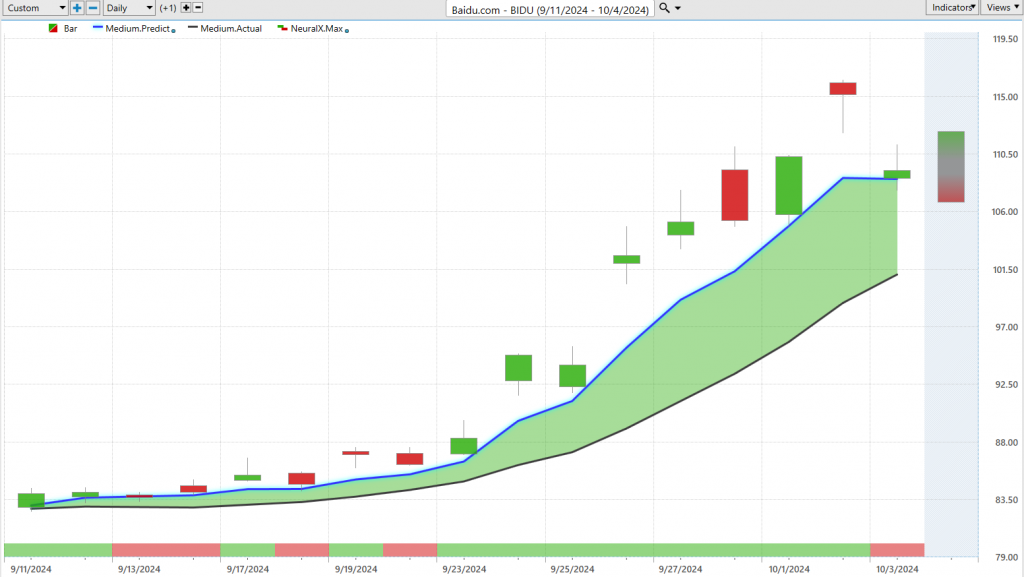
Here’s shares of Baidu ($BIDU). Here we see this blue line crossing above the black line, and again you’ll notice the neural index running sideways, moving down to this red position. We get a little sideways price action, but the predicted moving average is actually separating. And so, we saw a lot of stocks out of China last week; we looked at Las Vegas Sands which does a lot of work in Macau, um, and so this is what we’re seeing as far as these stocks and this trend moving to the upside. And we can take a look at this overall trend here, uh, in shares of Baidu; you’ve got a 30% rally in just the past 16 trading days, so really exciting stuff here, but of course, traders want to say okay well how can I use those predicted highs and lows to get a really nice entry here? And so, you’ll see that as the market starts to trend higher, we get this swoop down towards this predicted low, another gap down here before an acceleration higher, uh, and now we’re just seeing again a lot of volatility in the market as we see this past week seen a little weakness in the S&P 500, uh, but these entries coming in really several weeks ago, uh, from those fresh crossovers to the bullish side within Vantage Point.
Energy is looking a little bullish here.
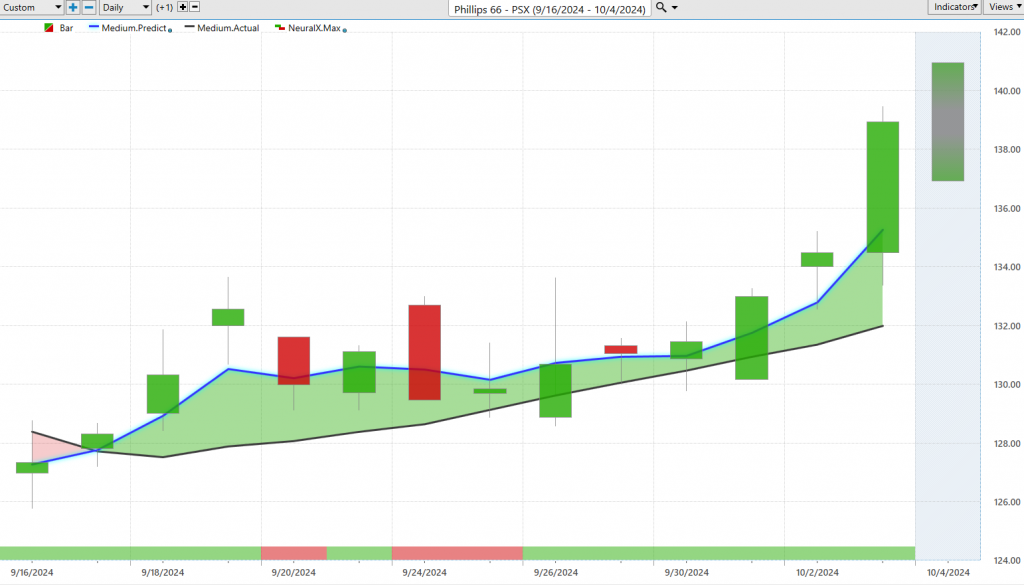
Next is is Phillips 66 ($PSX), actually looking a little bullish here. We’re seeing, uh, the blue line cross above the black line here in shares of Phillips 66, and really the point here is just to highlight how all of these predictive indicators work on a wide range of markets, so in this case, you see the neural index goes bearish, you get some sideways price action for these subsequent trading days, but the blue line is remaining above the black line, the overall trend is up again, once the neural index starts to get bullish again, we see that momentum pick up, and share price pick up, but we can really pinpoint all of this down to again these predicted highs and lows, and you see days like this where a lot of the, almost completely, you know, price action is bullish, well you end up getting a lot of volatility, move down to the previous predicted low, and then the market continues to trade here, so you see numerous opportunities at 130 before you accelerate up to about 139 most recently here uh, in shares of Phillips 66.
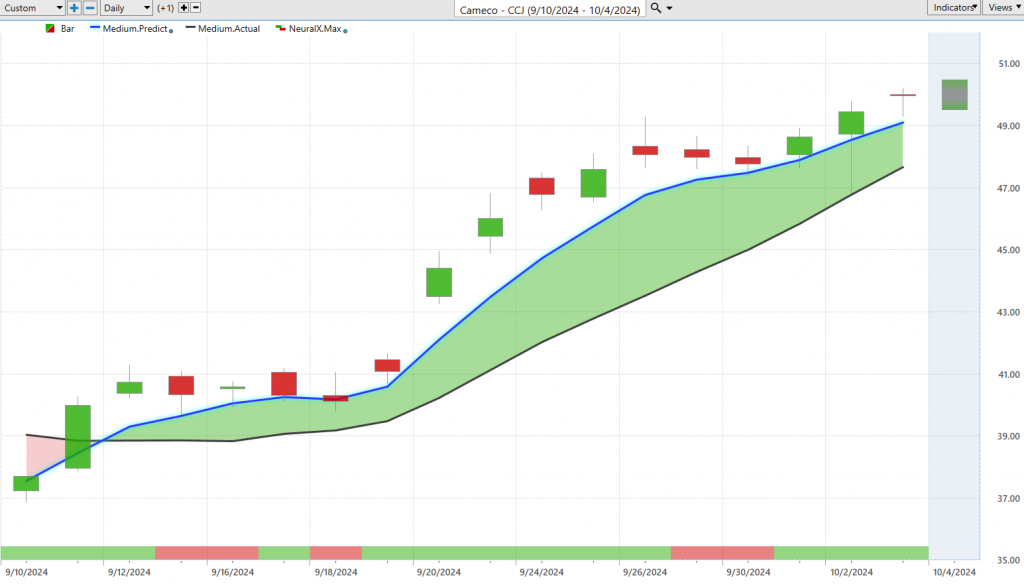
Here’s a market we looked at Cameco ($CCJ) last week; it’s Cameco $CCJ, uh, and again really nice move here, again coming out of the energy space, uh, but here we see overall this move now up over 24% in just the past 15 trading days, but look down at that predicted neural index here, right? It gets bearish here, we get this little sideways run, subsequent price action. Again, it gets bearish here; you actually get a little bit lower the next trading day but a very bullish forecast, so you see that blue line very much above the black line, uh, and of course, the overall trend very much to the bullish side here, over a 20% rally here in a very short period of time, here this is past 16 trading days.
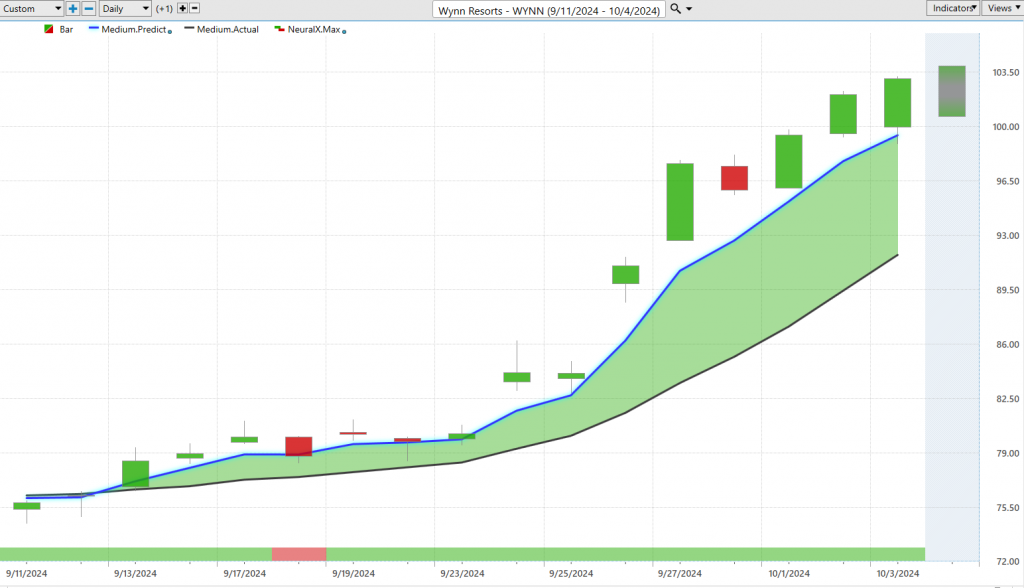
Uh, and lastly here, here’s Wynn Resorts. So, what happens with the Wynn Resorts ($WYNN) software is we actually see a lot of these predictive indicators get bullish, uh, in correlated markets. So, you look at Las Vegas Sands, you look at Wynn Resorts, and you say that something’s going on in this space; we have extremely bullish price action and forecasts. So, again, your neural index goes bearish here, a couple of days of weakness, but a very good opportunity to be buying down towards the predicted lows with that weakness, and of course, well, we run right into those levels and accelerate higher. So, again, you see here if you have these orders waiting at some of these levels and you’re prepared to get long, get these excellent entries in the uptrend, uh, can really exploit that, uh, to your advantage here. So, Wynn Resorts here, really nice opportunity, uh, being driven higher here, shares up 32% in just the past 15 trading days, so really exciting stuff there. So, again, you always just want to highlight whether you’re on the bullish or the bearish side, how these predictive indicators are really going to assist you, uh, moving forward each and every trading day, so you can really get involved when you notice these big shifts in the market, but also manage the opportunity more effectively, be adding to the position when it’s appropriate, uh, and getting defensive when it’s appropriate as well. So, uh, that’ll be it for our Hot Stocks Outlook for October 4th, 2024. Thank you all for watching; best of luck out there, and bye for now.
So, that’ll be it for our Hot Stocks Outlook for October 4th, 2024. Thank you all for watching, best of luck out there, and bye for now!