


Register for a Free Live Training
The Hot Stocks Outlook uses VantagePoint’s market forecasts that are up to 87.4% accurate, demonstrating how traders can improve their timing and direction. In this week’s video, VantagePoint Software reviews forecasts for SPDR SPY($SPY), IBM ($IBM), CubeSmart ($CUBE), EBAY ($EBAY), NVIDIA ($NVDA), Workday ($WDAY).
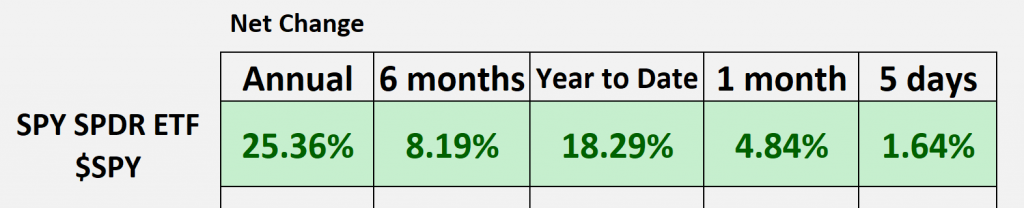
SPDR SPY ETF ($SPY)
VantagePoint A.I. Hot Stocks Outlook for September 13, 2024
Hello again, traders, and welcome back to the Hot Stocks Outlook for September 13th, 2024. I hope you all have had a nice week out there in the financial markets, and as always, we’re here to take a look at the most recent VantagePoint AI predictive forecasts.
So if you haven’t already, you can go ahead and click on the link in the description below and sign up for a live demonstration to learn all the specifics about how these predictive technologies and indicators are helping traders make much better trading decisions out there in the marketplace.
And so, a lot to cover this week. As we typically do, we take a look at the S&P 500 just to get a sense of where market prices have been over these given stretches of time. And so, we’ve had a pretty decent week here—a lot of volatility over the past few weeks—but that’s brought us up over 18% year-to-date.
And more recently, we’ve seen a big shift actually this past week here in the tech space and a lot of the semiconductor stocks, and a lot going on there.

So let’s go ahead and start out. We have shares of IBM. It’s a really good example of how all of these predictive indicators work together, and we’ll actually break this down piece by piece as we go through many of these subsequent charts.
But here with IBM ($IBM), what we have here is daily price action, right? So each one of the candles that you’re seeing there, that’s going to represent a full and complete trading day. And it’s right up against that price data that the first thing you’ll notice is there is a black line and a blue line value.
So the black line that you’re seeing there, that is actually a simple moving average. So it’s a very common technical analysis indicator, and in this case, it’s a 10-period. So it looks back at the previous 10 closes, adds it all together, and then divides by 10.
But really, the problem with a lot of technical analysis tools like this is that all of the data comes from the past. And so, we really want to use that as our baseline, right? Letting us know where market prices have been, but there’s really no predictive capability there.
And so, what VantagePoint traders are able to do is compare that black line value to this proprietary predicted value. And so for this number—essentially a calculation of future prices looking forward through time—well, for that number to get plotted, this is where the technology of artificial neural networks comes into play, and they’re performing what we would call intermarket analysis on shares of IBM.
And so what that means is instead of just looking at the past, right? Instead of just reconfiguring the data and updating it each and every day, well, the technology is able to look at other markets that are known to drive and influence the future prices of this target market, or shares in this case of IBM.
And so it’s going to be looking at things like these big ETF groups when we look at, you know, XLK, and the Q’s, and the SPY. It’s able to understand how those relationships are affecting perhaps an individual stock you might be trading, but it’s also finding relationships within individual stocks and other equities throughout the market.
And what’s very important to understand is some of these relationships can lead the market or lag the market; some can be positive or inverse correlations. And that’s what the technology is able to do—is really summarize that into a very robust and accurate forecast.
And so it really goes down the line, whether it’s things like global interest rates, whether it’s things like global commodities—which we’ve seen things like gold and platinum do really well, and that’s driven up a lot of related stocks throughout the marketplace—as well as, again, just things like the value of the dollar index, the global currencies that certainly affect the value of the S&P and individual stocks within it.
And so it takes this global approach, summarizes all those relationships, and then generates a highly accurate predictive forecast, which is highlighted through all of these indicators that we take a look at each week.
And so whenever we see, in this case, this blue line cross above the black line, well, it’s suggesting that average prices are going to start moving higher, and traders may want to look to take long positions.
And so you may be a longer-term swing trader; in this case, you see we get about a 10%, 12% rally over the past 24 trading days. But you also might be a shorter-term trader, right? Looking to take little pieces out of the market. And that’s where tools like the VantagePoint predicted neural index—which you see at the very bottom of the chart here in this bar that goes from green to red back to green—and also the VantagePoint predicted highs and lows, so actually an intraday prediction of where prices are headed next.
Now, if we want to focus on the neural index, this is just forecasting ahead 48 hours, right? Short-term strength or weakness just over the next couple of trading days, and it has an extremely high level of accuracy associated with this indicator—so upwards of 86%, 87% accuracy across a huge number of markets.
And so what we can see here is, as that neural index is green, you tend to get a lot of momentum in the market. When it goes down to red, you may get some sideways and consolidation, but as long as the overall trend is up, well, traders would want to keep exploiting that bullish trend.
And when we really add into that our predicted high and predicted low range, well, this is really what takes things up a notch here, where we can look back at all of those predictions and see how accurate all of them were.
And so we can imagine a trader coming in and saying, “Okay, well, you know, I’m looking to buy shares of IBM. The predicted moving average is bullish; our neural index is bullish, and look how many of these levels act as ideal opportunities to scoop up some shares and potentially take some quick profits or establish and build a longer-term position.”
So you even see this past week, where we’ve seen a lot of strength—look at this move all the way down to the predicted low almost perfectly—and then the market continues its trend higher. Really, just that move there from predicted high to next day’s really predicted low to next day’s predicted close, we got about 3.8% rally there just in the past couple of days in IBM.
So this is how traders are utilizing these different technologies and tools to, again, make better trading decisions that match their approach to trading the markets.

Here, shares of CubeSmart ($CUBE), a similar example here, where again we see that blue line cross above the black line. And what you want to keep an eye on is you’ll get these periods where the neural index will go bearish, and you tend to get a couple of days of sideways price action.
Remember, these are daily bars, so these are longer periods of time where the market’s potentially running sideways and you’re not getting that rally in the market. But of course, we have all the way down to predicted highs and lows for each trading day.
So as this market trades higher, you understand, “Okay, well, after this trading day, expect some weakness; expect the market to move down towards these predicted lows.” But the overall trend is up, so you know you want to maintain that buying behavior in the market.
And look how efficient this is as the market keeps scooting down towards these predicted lows, but obviously the trend is still to the upside. And again, this past week, getting this market moving down to the predicted low and rallying higher as it closes above the range there, and looks like the trend is likely to continue.
So again, we can look at the overall move here from really where those fresh signals got started, going all the way back—really as the midpoint in August—signaling, “Look, this trend is going to start moving higher,” and we can use those tools day-to-day to manage the opportunity as the market goes up about 12% in just 22 trading days.

Next opportunity here, shares of eBay ($EBAY). So here we get a little bit more volatility, but what I want to highlight here is once that crossover comes through, we never get that crossover to the bearish side.
So again, you’ll get periods of sideways and consolidation; you see some of these longer stretches where the market runs sideways. But look how the market and the predicted moving averages start to skew and separate, right? So this is where those intermarket relationships are going to act to push and pull against the market in those forecasts.
And as the market’s more likely to skew while those intermarket relationships may be pushing and separating our predicted moving averages, skewing that neural index to the bullish side.
And again, we’ve just seen a lot of strength in a lot of areas throughout the market, especially the tech side of things this past week, as a lot of these forecasts and signals and indicators get bullish.

Here, shares of NVIDIA, and what I wanted to highlight here was just the neural index so we can drive this home.
So remember, this is a 48-hour indicator, so it’s really tuned and configured to say, “Okay, well, how can we get the most accurate prediction for a 48-hour window?” So shorter-term traders may want to lean on that as far as guiding whether they want to be buyers or sellers in the marketplace.
And so what we can see here is when the neural index is bearish here, what is that indicating? A couple more days of weakness, a couple more days of weakness, and continuing those couple more days of weakness until we actually get to the beginning of this week. So this would actually be Monday’s candle. You see that, “Okay, well, something shifted in this market,” right?
So not a huge uptick here as far as price, but you see that neural index skewing to the bullish side. And again, we’re seeing a lot of these predictive indicators skew to that bullish side and highlight some strength coming into the market, and a really just straightforward forecast here, right? 48 hours, doing a good job monitoring and moving that forward day after day.

Here, shares of Workday ($WDAY). And so what I want to do is transition here to the predicted highs and lows. And what’s interesting about this is even with earnings here, right? So we can’t really accommodate for, you know, earnings, right? The software doesn’t know earnings are coming up; it doesn’t calculate that there’s going to be an increase in volatility here.
But what it does do is adapt. And so you’ll notice that each and every day we have this market going higher; market adapts. The predicted highs and lows do a very excellent job. We get the big move in earnings, but then the software is able to say, “Okay, well, what happened here in Workday? What happened in those intermarket relationships? And let’s get this forecast back on track.”
And you see how good every single day it’s coming in here and saying, “Okay, let’s keep adjusting, understanding how these levels are changing, and allow traders to make the most of these gyrations and moves in the market.”
So there’s been some really nice opportunities playing out here, certainly some of these stronger markets and strong trends really starting to break out. But this is where the predictive indicators from VantagePoint do a good job—they start skewing to the bullish side depending on the particular market you’re trading and how those intermarket relationships are affecting the likely future trend and direction of prices here.
So if you haven’t already, like I said, make sure you click on that link in the description below. You can get a live demonstration, learn all about how these tools can help impact your trading strategy and your approach, really regardless of time frame and style, and lean off of these highly accurate AI-driven predictive forecasts.
So once again, this has been the Hot Stocks Outlook for September 13th, 2024. Thank you all for watching, best of luck, and bye for now.


