


Register for a Free Live Training
The Hot Stocks Outlook uses VantagePoint’s market forecasts that are up to 87.4% accurate, demonstrating how traders can improve their timing and direction. In this week’s video, VantagePoint Software reviews forecasts for SPDR SPY($SPY), Chubb ($CB), Microsoft ($MSFT), Tesla Motors ($TSLA), Uranium Energy Corp. ($UEC), Pfizer ($PFE), Boeing ($BA), Travelers ($TRV), Wingstop ($WING),
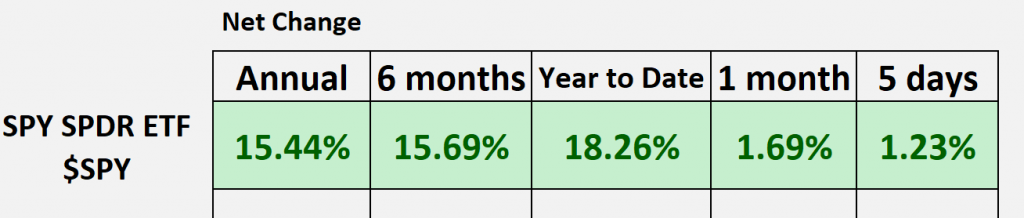
SPDR SPY ETF ($SPY)
.
Hello again, Traders, and welcome back to the hot stocks outlook for September 15, 2023. I hope you all have had a great week out there in the financial markets. As always, we’ve got a ton of opportunities to look at here, and as we typically do, let’s just hop into that SPY ETF and get a sense of where market prices have been over a given period of time. Here, we can see going back 12 months, we’re about 15 on that SPY ETF. Year-to-date, pushing up close to 20, and we’ve seen some strength return to the market. So we’ve had a pretty tough about five or six weeks or so as the NASDAQ and Tech stocks sold off, and this is why it’s really important to be positioned in the right markets, really identify where that strength is coming in and what markets are really leading the way. So if you haven’t already, make sure you go ahead and click on that link in the description below, and you can get a live demonstration and learn more of the specifics about how this Suite of predictive indicators can really help you make much better trading decisions day in and day out in the marketplace.
Now, I’ve pulled a lot of markets to take a look at here today. We’ve got Chubb, Microsoft, Tesla, Uranium Energy Corp, Pfizer, Boeing, The Travelers, and Wingstop. And I bring all these through to really highlight some of these important themes that have been playing out in the market.
The first theme is a release of some strength that came in a few weeks ago. We highlighted this with Tesla a few weeks ago as far as some recent strength coming in. But let’s take a look at a few of these markets.
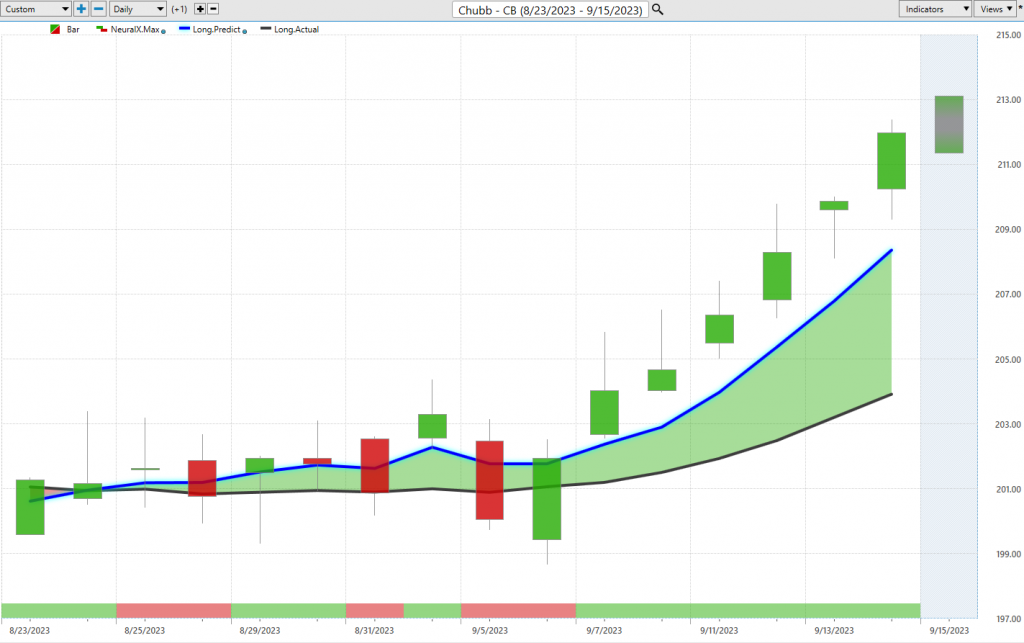
And what we have here with shares of Chubb is daily price action. Right, so each one of those candles that you see there represents a full and complete trading day. And it’s right up against all that daily price action. And what you’ll notice here is that there is a black line and a blue line value. So the black line that you’re seeing there, that is a simple moving average, and specifically in this case, it’s a 10-period simple moving average. So what you do is you just take the last 10 closed prices, you add those all together, and then divide by that number. And what that offers is really a smoothing out of where market prices have been, so it acts as more of a baseline to let us know, “Hey, where has the market already been over a given period of time?” But the problem with technical analysis tools like that, and really there’s a lot of them that all pull their data from the past, and so what that means is they’re always going to be lagging behind what’s already occurred in the marketplace.
And so what we want to do here with Vantage Point is actually use that as a baseline of comparison. And so whenever we see this blue line value, essentially a number that’ll get plotted on the chart every evening for the Trader, well, this is Vantage Point’s predicted moving average. And for that number, essentially a prediction of future average prices to be calculated and plotted, well, this is where the technology of artificial neural networks comes into play. And then we’re performing what we would call inter-market analysis on shares of Chubb. Well, what does it need? It means a lot of data so that it can generate highly accurate predictions, but you want that to be relevant data, right, to the market or question that you’re trying to answer. And so specifically for Chubb, what the software has identified are known markets that will drive and influence these future prices.
So in that way, we’ll use markets like, you know, the XLK ETF, it can be individual stocks, it can be things like the value of the dollar Index, which is critically important, things like the SPY or the QQQs, things like the gold market, silver market, soybean, wheat. So it takes this global approach, looking at how all of these known markets that are affecting and influencing the target market are going to influence prices moving forward. And so what happens is that artificial intelligence process is generating those accurate price predictions, and it’s those price predictions that are used to generate these indicators.
So rather than having tools that are simply just looking at the past and getting dragged around by what’s most recently occurred, what we have is a technology that’s drilling down on the factors that matter specifically for the markets that you’re trading and generating a true prediction of where things are headed. So again, whenever we see that blue line cross above the black line, it’s suggesting that those average prices are going to start moving higher. You, therefore, want to go long, take profits on longs. Keep it pretty simple here. And you see shares of Chubb here over the past 15 trading days, up about five percent.
But I want to go into more detail here. Now, if you look at the bottom of the chart, you have this bar that goes from green to red back to green, and this is also utilizing that technology of artificial neural networks. But it’s tuned to solve a different problem for Traders, and this being a short-term, really two-day forecast of strength or weakness in the market. So this gets updated every day looking forward, again, for those next 48 hours of trading, and you’re provided a predicted high and a predicted low, so really an intraday range provided for the next trading day that hasn’t yet occurred so that you can set limit orders, profit targets, and really do whatever you need to do here.
And so what we do each week is we take a look at how accurate all of these predictions are. And even on this trading day where it looks like, “Hey, you came way out of the range there,” well, we see this quite a bit. It’s just a Friday, and all that’s happening is you’re moving to this predicted low. You see all the price action that was trading on the higher end there, you’re moving up to that predicted high, you move lower on the Friday here, and then immediately the overall trend taking place and really things kicking off here.
And so we’ve seen a lot of strength in the marketplace in specific areas, but you do want to be quite cautious in where you try to go ahead and get that exposure. And so this is why, again, once we understand how all these tools work, well, then we can take them and say, “Okay, well, where are their safer places to trade?”
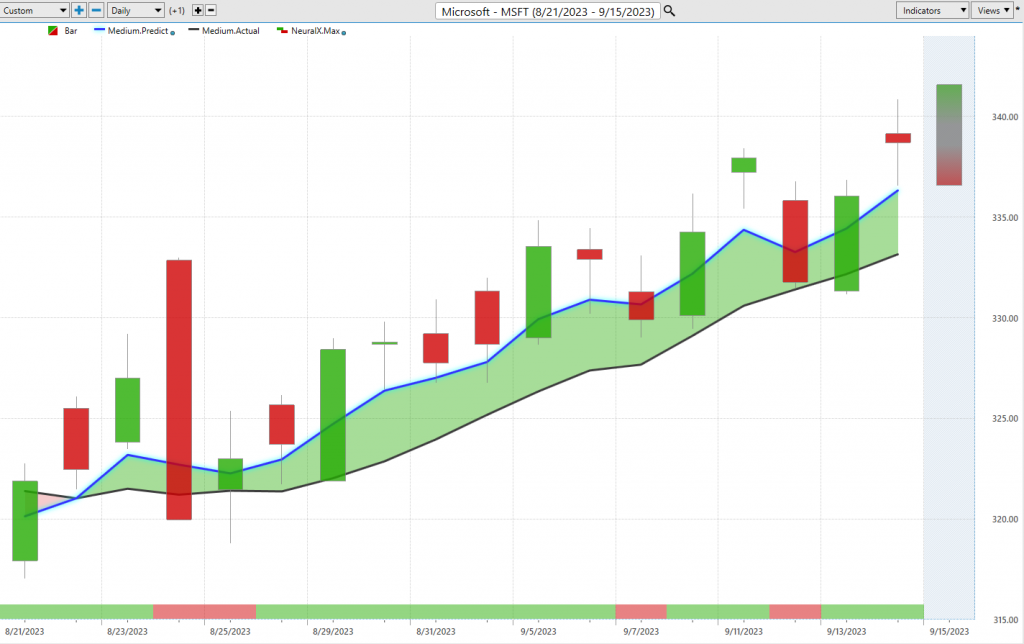
Well, let’s take a look at Microsoft, and this can typically be indicative of what’s going on in the broader markets like the SPY and the QQQs and some of the bigger stocks. And so we see here with shares of Microsoft, well, what do we have? We have the blue line crossing above the black line, a couple of areas here where that short-term 48-hour forecast gets bearish, but very clearly here, that blue line is still very much above the black line value. We’ve seen a nice rally here, about five percent, about 17 trading days in shares of Microsoft,
but more importantly, just highlighting the overall strength in some of these bigger shares and really the overall indices. Typically, if Microsoft‘s going up, the indices will hold up pretty well here. And so we see things doing well in Microsoft.
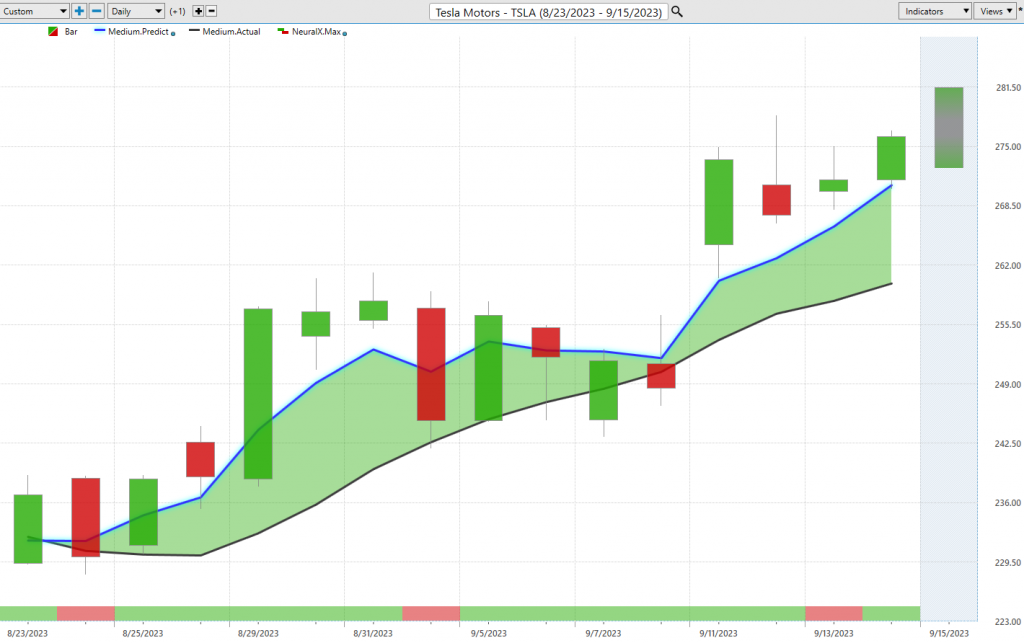
But we can take a look again at those predicted highs and lows. So you have all of these intraday levels that are really provided for you the day ahead of time so you can scoop up shares in the right environment and make money as the market moves higher. So let’s go ahead and move over to Tesla here. So this is something where really early on as we saw this crossover coming through really on this Thursday and Friday that, hey, we’re starting to see some strength come into shares of Tesla. That blue line is clearly above the black line. And again, for the past few weeks here, that has remained to be the case here, and we’ve got about a 19 percent rally. Tesla really leading the way as far as some of the bigger stocks and leading the indices here. So a 19 percent rally in just the past 14 trading days. And it’s critically important to have these tools so that you can keep adapting to the changing market environments. Where we had Tech weakness come on in, well, we saw that weakness in Tesla, but now that’s reversed, and we already had a 20 percent rally to the upside, and that may continue. And this is why it’s important to utilize these tools and understand that, okay, well, when you have an opportunity and that blue line remains above the black line, well, these things can turn into some really tremendous opportunities.
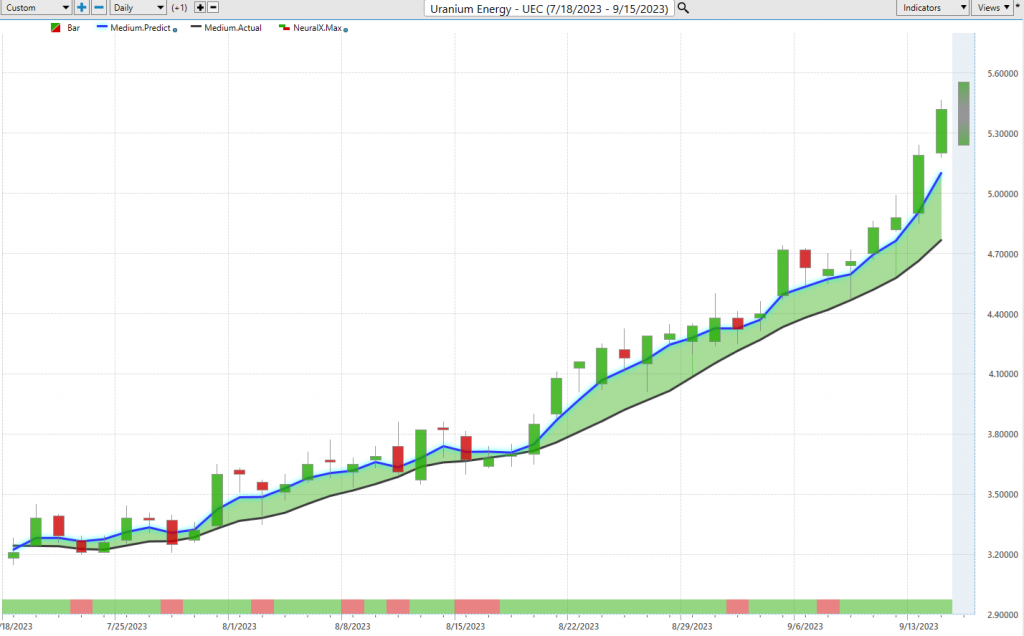
So here you see in UEC Uranium Energy Corporation, we see all the way back in July that Blue Line crossing above the black line. And look how many of these predicted high and low levels for what’s now been over two months on the calendar. Every single day you have these levels the day ahead of time that says, “Okay, well, if you want to be a buyer, look down towards these predicted low levels.” And if we look at this, this is going to be about, you know, at least a dozen entries here, two, three, four, five, six, seven, eight, nine, ten, eleven, twelve, thirteen, about 14 entries, as this Market almost doubles in price. There’s about 14 entries over the past two months as the market goes up over 41 trading days, about 63 percent, right? So I mean, even a thousand shares are heavy up a couple thousand dollars, and this is a very cheaply priced stock. So again, as we’ve seen certain markets improve, we can keep managing those opportunities. We never know when that blue end is going to cross below the black line, but when it does, we’ll get that very strong indication that we need to adapt to that changing market environment.
So here we’ve seen a lot of strength, and that was the whole point of this first session here is to say, okay, well, we’ve seen the past few weeks some strength come in, some areas where strength has been persisting, and the forecast looking very bullish. But what we highlighted last week was how you really may want to have a hedged portfolio, really not get caught up in the wrong stocks.
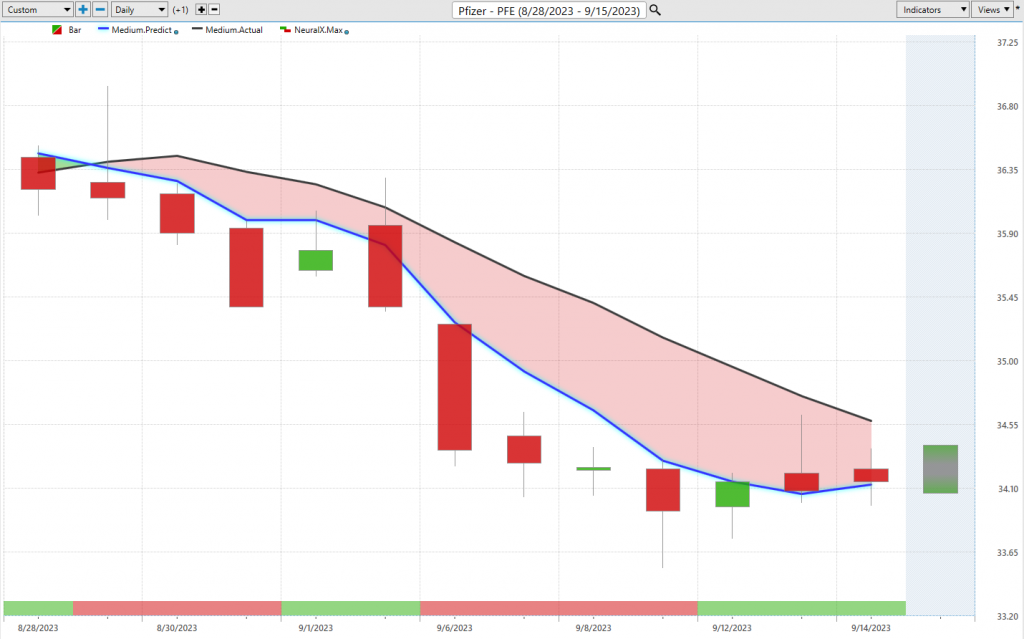
Well, here’s shares of Pfizer, and a good example here of that Blue Line crossing below the black line, neural index bearish. You get a little blip here where you get a little bit of a move higher, just over a single trading day, a little bit of sideways price action as we are seeing just general strength come back into the market. But what do we have here with shares of Pfizer? Well, we have a very weak Market, shares off about five, almost six percent over the past 12 trading days. And if you want to hedge and potentially get some of that bearish exposure in the portfolio, well, you have all of these really exceptional levels to help you go ahead and do that and manage that opportunity. So really nice opportunity there in shares of Pfizer to the downside. Another situation like this here, Boeing.
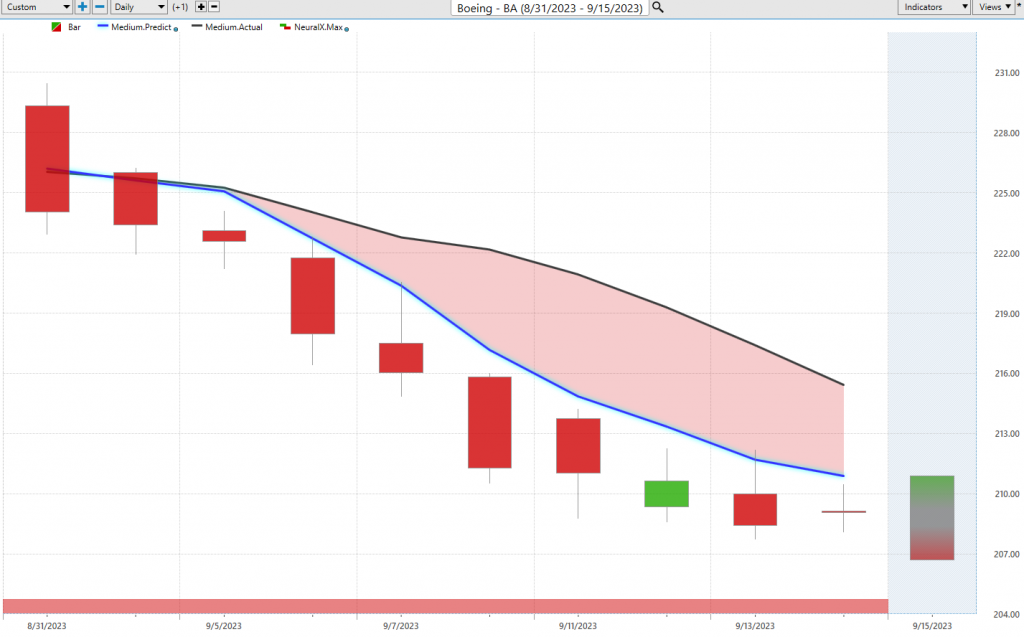
So the past few weeks, there’s been some decent opportunities to get long. We’ll highlight that here with Travelers and Wingstop, but what’s going on with Boeing? We have this Blue Line crossing below the black line, neural index about as bearish as it can be, and your predicted high and low ranges going lower and lower each and every trading day. So it makes it very easy to say, “Okay, well, do I want to be trading Boeing? Well, absolutely not. If anything, maybe short and take profits on shorts on the Boeing side and look towards where these markets are seeing this blue line cross above the black line.
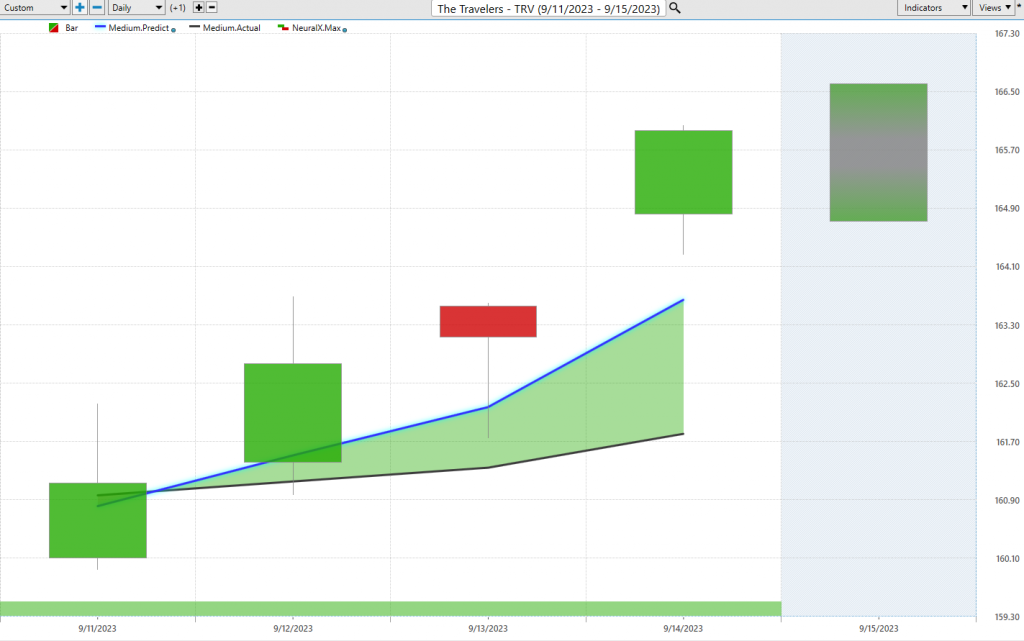
So here’s Travelers and Wingstop, and this has been more recent as we’ve seen more recent strength come into the market.
So he says Blue Line cross above the black line, a lot of strength from the neural index, and this really would be, you know, what we might call the buying day where you really want to get that position on. You see how effective things like the Vantage Point predicted low here are so that predicted low gets filled and we’re pretty much gapping up and seeing a lot of this strength potentially persist here. So this is how we, you know, when we’re looking back at some of these previous opportunities, well, what do you want to be doing? Well, getting those early entries. So as that trade really breaks out like you have in, you know, Uranium Energy Corporation here that you’re on board and you’re participating as shares improve and do well.
So, here we’ve got an entry already where share price is up, you know, two and a half percent just over the past two trading days, and we’ll see if some of this continues.
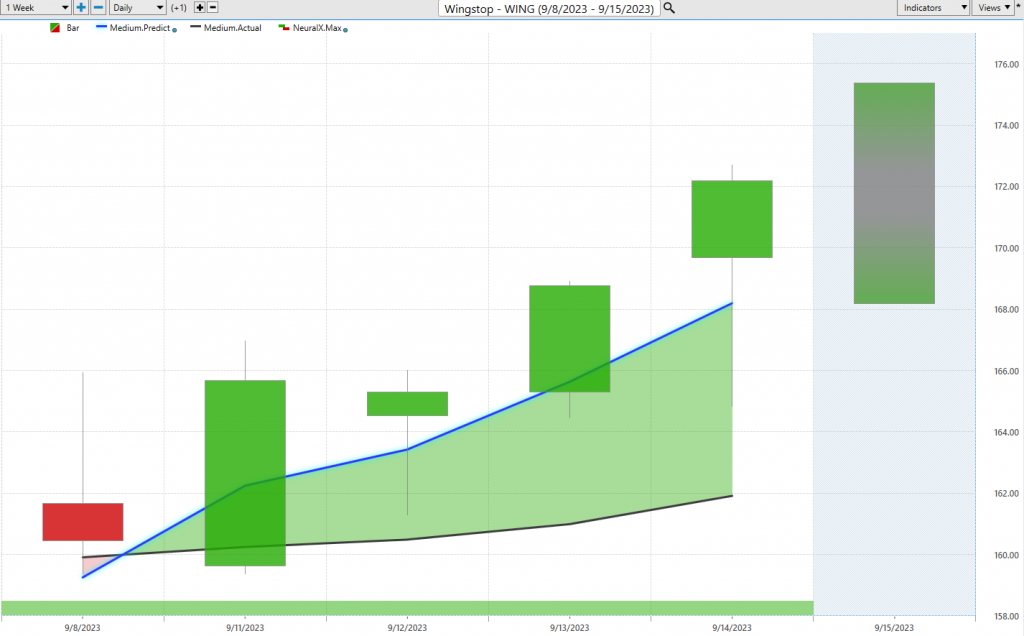
Lastly, here, shares of Wingstop, again some more of these recent opportunities where we see these Blue Line predicted moving average Crossing above the actual moving average setting up these next trading days that says, “Okay, look towards your predicted high and low levels to potentially put on a position.” And again, some really nice guidance here that says, “Okay, look down towards that predicted low.” We see even yesterday getting filled at the predicted low and moving a bit higher still. So really nice opportunities here spread out throughout the market. But you can see how there’s been some things that have been strong over the past few weeks, some areas of absolute weakness that you want to avoid, and even some more strength sort of rolling through. But what you need to have are things like Vantage Point and intelescan feature.
And what this allows traders to do is actually get a heads up as soon as that blue line and predicted moving average crosses above the black line. You can see where that’s happening throughout the market so you can really identify the best places to maybe go ahead and set up and participate in the next oncoming rally. So we’ll go ahead and leave it there. But once again, this has been our Hot Stocks Outlook for September 15, 2023. Thank you all for watching. Best of luck, and bye for now.


