Register for a Free Live Training
The Hot Stocks Outlook uses VantagePoint’s market forecasts that are up to 87.4% accurate, demonstrating how traders can improve their timing and direction. In this week’s video, VantagePoint Software reviews forecasts for SPDR SPY($SPY), Qualcomm ($QCOM), Applied Materials ($AMAT), HIMS and HERS Health ($HIMS), TESLA ($TSLA), Amazon ($AMZN).
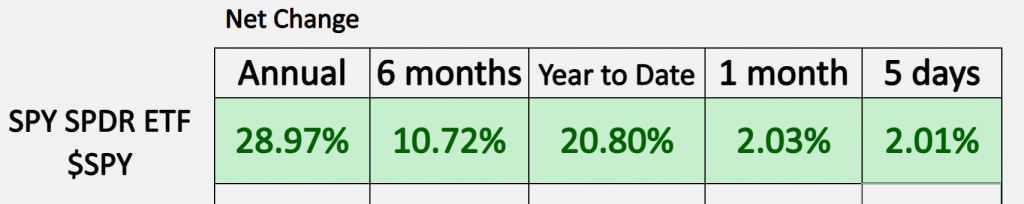
SPDR SPY ETF ($SPY)
VantagePoint A.I. Hot Stocks Outlook for September 20, 2024
Hello again, traders, and welcome back to the Hot Stocks Outlook for September 20th, 2024. I hope you all have had an excellent week out there in the financial markets. As always, we’re going to take a look at the most recent VantagePoint A.I. predictive forecast. If you haven’t already, you can go ahead and click on the link in the description below to get yourself signed up for a live demonstration so you can learn all the specifics about how these predictive technologies are helping traders make much better trading decisions day in and day out in the marketplace.
Now, as we typically do, we like to take a look at the SPY or the S&P 500 ETF. We can see this past strength that we’ve had over the past week has pushed us up over 20% on the year-to-date numbers. We’ve had a really nice week, and this is really what I want to highlight: how we can identify a lot of this strength that we’ve seen actually recently come into markets this past week and where the VantagePoint forecasts are really guiding the attention here.
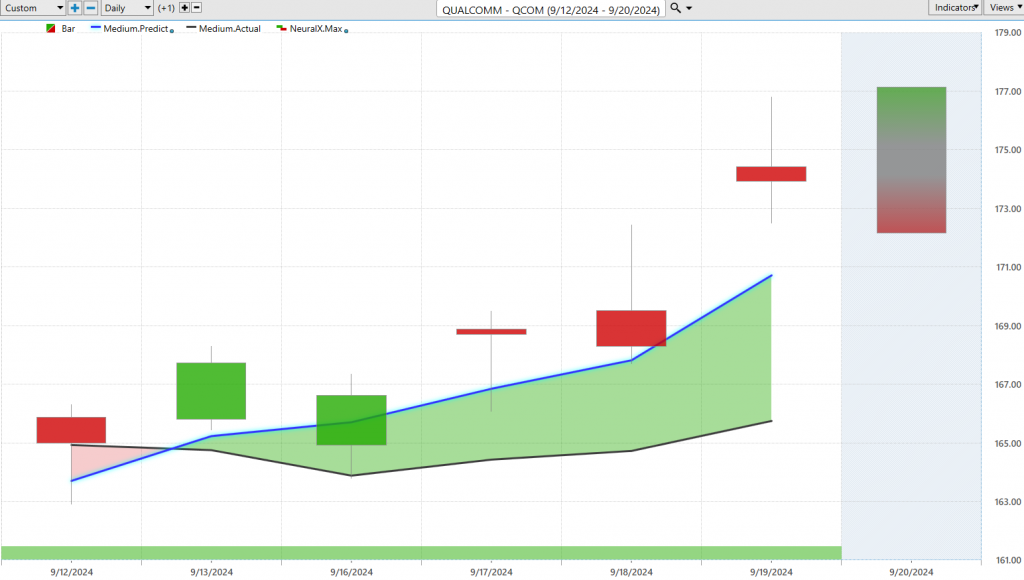
What we can do here is start out with shares of Qualcomm. We also have Applied Materials, Hims and Hers Health, Tesla, and Amazon. All these forecasts really work the same way, but we’re going to combine all these separate predictive indicators generated via the technology.
What we’re looking at in each chart is daily price action. Each one of these bars that you see really highlights the past week of trading here. Right up against that price data, you’re going to notice that there’s a black line and a blue line value. The black line value that you’re seeing there is actually a simple moving average—this is a very common technical analysis tool. In this case, it’s a 10-period, so it looks back at the last 10 closed prices, adds those all together, and then divides by 10. That acts as a good measure of where market prices have been; it’s really our baseline that we can use for comparison with these predictive indicators, but it’s always going to lag behind the market because all the data is coming from what’s already occurred, and it’s also only looking at Qualcomm in isolation. It doesn’t know what happened with the S&P 500, NASDAQ, or other tech stocks.
What we’re able to do is compare that black line to this blue line value, and for that number to be calculated and plotted against the chart, this is where VantagePoint is performing what we would call intermarket analysis to generate what we would call these predictive indicators or a predicted moving average. Specifically for Qualcomm, there are dozens of markets that are known to drive and influence future price. This can be things like the NASDAQ, the Q’s, the S&P 500 ETF, or even XLK (the technology ETF), but it’s also able to find and understand subtle relationships between stocks, whether this be other big tech stocks like Nvidia, the value of the Dollar Index, global interest rates, or even global commodities like gold or platinum.
It takes this global approach to understanding specifically what are the markets that are driving and affecting the target market in this case that you’re trying to trade. Whenever we see this blue line cross above the black line, it’s suggesting average prices are going to start moving higher and trend traders may want to look to take a bullish position.
What’s really interesting about these features within VantagePoint is we have things like the VantagePoint IntelliScan, which actually allows you to search and scan for all of these fresh signals. What we actually saw this last week throughout the tech space, and mentioned it a little bit in last week’s Hot Stock Outlook, was we’re starting to see strength around these semiconductor stocks. We looked at Nvidia and some of these big stocks and started to see, hey, they’re starting to move higher. Well, here in Qualcomm is a perfect example of getting that blue line crossing above the black line. As long as it remains above, we’d expect the overall trend to move higher.
We got that information around the Fed, and sure enough, there was a five and almost six percent rally just in the past four trading days. This is really just last week, going back to Monday; this would actually be Friday’s candle from last week, really just going into the week saying, “Look, you want to be buying on this next trading day.”
So if you look at the very bottom of the chart, we’ll have more examples of this, but you see this bar that’s green. Well, that can adjust every single day; it can be green or red, and what it’s indicating is strength over the next 48-hour window. In this case, we can see that really going all the way back six or seven trading days, that has been consistently bullish, telling you to expect strength over the subsequent 48-hour window. This is what again short-term traders can use to anticipate what direction they may want to trade the market for short-term trading. It’s extremely accurate, upwards of 86-87% on a very wide number of markets, and it holds that consistent accuracy so traders can lean on that.
And to really round out these forecasts, you’re even provided a predicted high and a predicted low, which is highlighted by this shadow candle that you see here. So what’s going to happen is the trading day is actually going to populate; it’ll fill in this space, but the predictions will stay exactly where they currently are, and what we do each week is take a look at those actual predictions. So we can see, every single day, you’re getting this updated forecast that says, “Okay, well, on this next trading day, where the trend’s expected to start moving higher, look down towards this predicted low,” and in this case, if you have an order waiting at that limit, it’s actually going to get filled at the open and then pretty much immediately start moving into profit.
This has really highlighted a lot of what we’ve seen throughout the market. We got a very seemingly very important turn in a lot of shares throughout the marketplace, and you see this leading to a five, almost six percent rally in just the past four trading days.
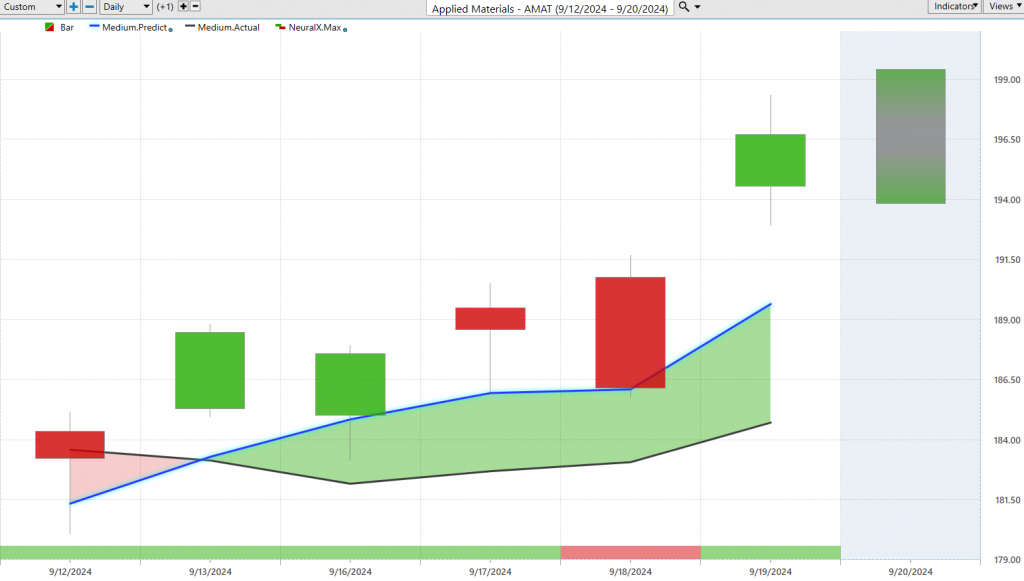
Now let’s go ahead and take a look at a similar situation, and again, this is where VantagePoint’s IntelliScans are really helpful, so we can actually scan, looking for where these predicted moving averages are crossing above the actual moving average, and get a sense of, you know, what sector that’s happening in, which particular markets we’re starting to see turn higher, and then go into the next trading day saying, “Okay, well, I have this roadmap that says where the predicted high and predicted low is, the neural index is bullish, the overall trend is up.” And this is where again traders can come in and say, “Okay, well, where should I be looking to establish a position?”
You see very similar price action, right? The market gaps down, immediately starts moving higher, but it’s throughout this tech space, and this is where we especially saw the NASDAQ do extremely well, and really outperforming the S&P 500 as we see many of these stocks perform very well and drive the markets higher. And so again here, you see a very nice entry into the market, almost a seven percent rally here in just the past four trading days.
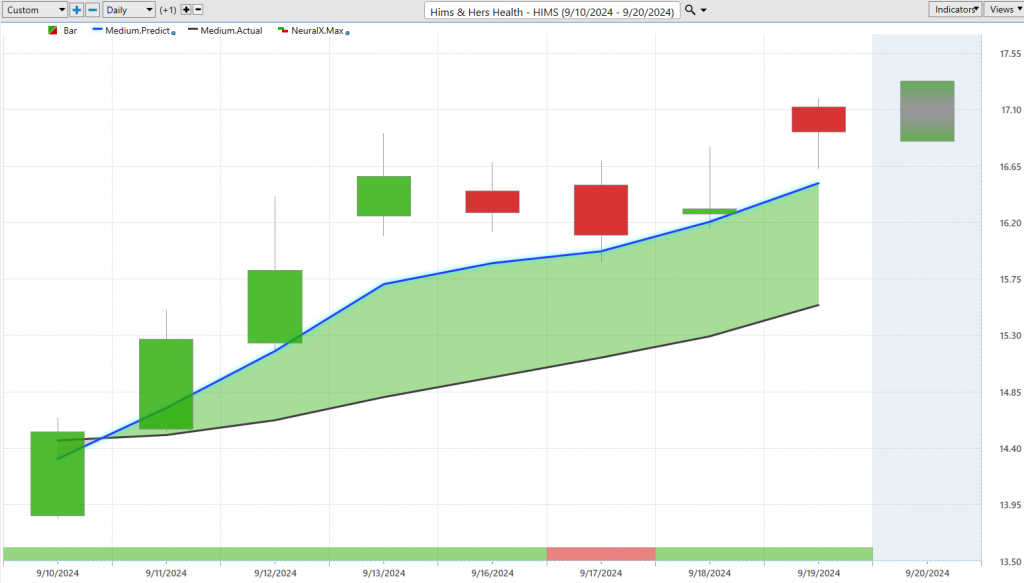
Here’s Hims and Hers Health, another example of seeing these crossovers all across the space. So this even going into last week and saying, “Look, there’s a lot of strength in these markets, a lot of these even smaller cap stocks starting to turn higher, and you may want to take a long position.” Here you see that as far as the predicted highs and lows, we don’t move down to these predicted highs and lows early, but look how good the software is at adapting and saying, “Okay, well, look for this market to start moving lower, look for the range to start coming lower here, but the overall trend is very much bullish.” And you even see on this subsequent trading day, you really don’t get anywhere with that weakness from the neural index, but once it gets back to bullish, you see that momentum picking up, and the rally continuing. So, really nice move here in shares of Hims and Hers Health. Let’s see, just really seeing that crossover here, you’ve gotten about a twelve percent rally just in the past six trading days.
Now, what’s interesting about this is we can really zoom in on things like the VantagePoint predicted highs and lows.
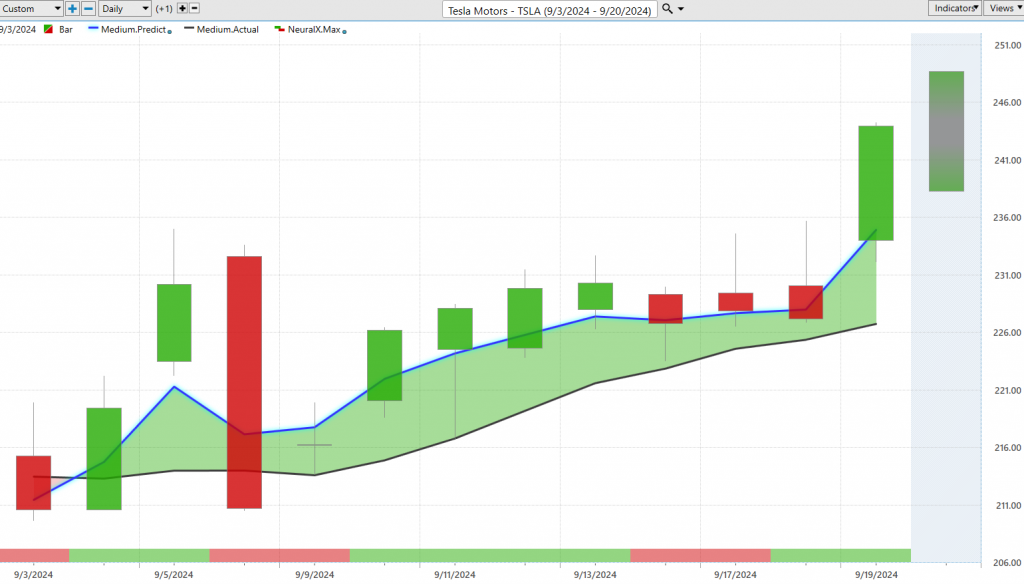
And how they deal really well with volatility. So in that last example, again, it’s the exact same thing: we have daily price action, we see this crossover coming through to the bullish side all the way back here on September 4th, but let’s look at those predicted highs and lows, and what I want to highlight here is, look how the market performs here. Right? We get a lot of volatility, where the market’s just gapping up, the whole market is consumed by that buying, and look what happens the very next trading day as we move into Friday and the weekend: you move straight down towards that predicted low level, and the overall trend continues. If we look at that predicted moving average, we’re still holding above the actual moving average, and then we see how those predicted highs and lows perform as the market starts
to shift forward. So before we get this move higher after the Fed interest rates announcements, we’ll see a couple of entries coming in down near the bottom part of this range, really down in the lower part of the daily range there, before we get this resumption of the uptrend here in Tesla. So really nice move there, and again, just highlighting again the recent strength that we’ve seen come in across the marketplace. So here’s about a sixteen percent rally from those essentially predicted lows that came in right after the crossover, and this really strong resumption of trend about a one hundred thirty-five percent rally higher there.
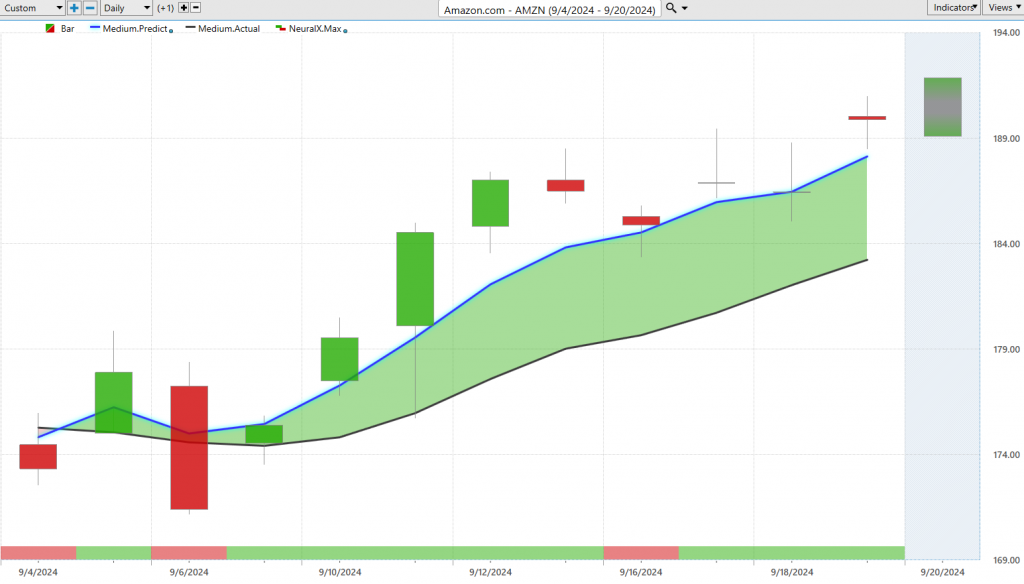
Lastly, Amazon, a very similar situation here, where you see this crossover to the upside, and look what happens. And this is where, when you get familiar with the technology, the stuff stands out all the time. All the price action is bullish, right, going into this Friday, and look where this market trades down to that previous day’s predicted low, hits it almost perfectly. Here, we have a predicted low of 17158, the market trades down to a low of 17116, and then immediately goes into that uptrend. We see as the software adapts, we get these moves down towards these predicted low levels, this one getting really close as well, and a really nice trend because, well, one, you’ve identified where the strongest trades in the market are. Well, those things have turned up. You see a couple of weeks ago here, like Amazon, Tesla starting to turn higher, and then seeing the broader market get strong over this past week as we see Qualcomm, Applied Materials, and more of the tech space start to turn to the bullish side.
So this is where traders, depending on you know what markets you want to trade, whether you want to trade the indices, whether you want to trade these individual stocks, you’ve got a good roadmap to guide your decision-making moving forward. And even if we do get volatility, well, those predicted highs and lows will readjust, get you back on track, so you can make the most of that trading opportunity.
So, once again, this has been our Hot Stocks Outlook for September 20th, 2024. Thank you all for watching. Best of luck out there, and bye for now.