Register for a Free Live Training
The Hot Stocks Outlook uses VantagePoint’s market forecasts that are up to 87.4% accurate, demonstrating how traders can improve their timing and direction. In this week’s video, VantagePoint Software reviews forecasts for SPDR SPY($SPY), Pfizer ($PFE), Microsoft ($MSFT), Phillips 66 ($PSX), Uranium Energy Corp. ($UEC), Boeing ($BA), Travelers ($TRV), Wingstop ($WING),
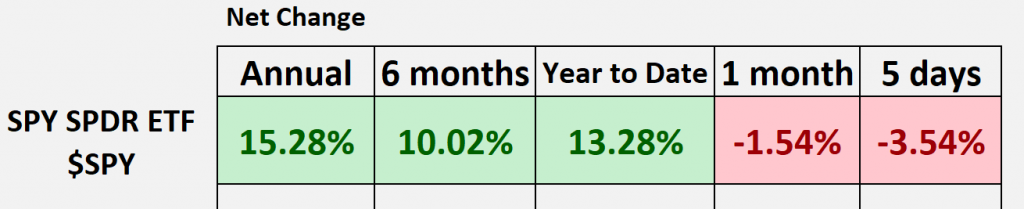
SPDR SPY ETF ($SPY)
Hello again Traders, and welcome back to the hot stocks outlook for September 22nd, 2023. Hope you all are having a great week out there in the financial markets. We’ve got a lot to talk about as we’re really seeing a lot of volatility come in and open up some new opportunities in the trading space. So if you haven’t already, make sure you go ahead and click on that link in the description below, and you can get a live demonstration and learn the specifics about how this technology of artificial neural networks can really help you make much better trading decisions in the marketplace every single trading day.
So, as we typically do, we can start out by taking a look at the SPY or the S&P 500 ETF, as we typically do, and we need to be a little cautious here as we can see over the past 12 months, we’re up 15 year to date about 13, but we’ve had some issues here lately. And this is why in last week’s hot stocks Outlook we sort of had a mixed outlook there as far as looking at bullish and bearish opportunities.
And as each day rolls by, you get more information indicating okay, what’s going on here and what do we need to be prepared for? So let’s go ahead and let’s revisit Pfizer, we’ve got Microsoft here, Boeing, Phillips 66, Uranium Energy, a lot of these from last week. Really reviewing what we’ve seen and how the predictive indicators from Vantage Point really help Traders get ahead of this.
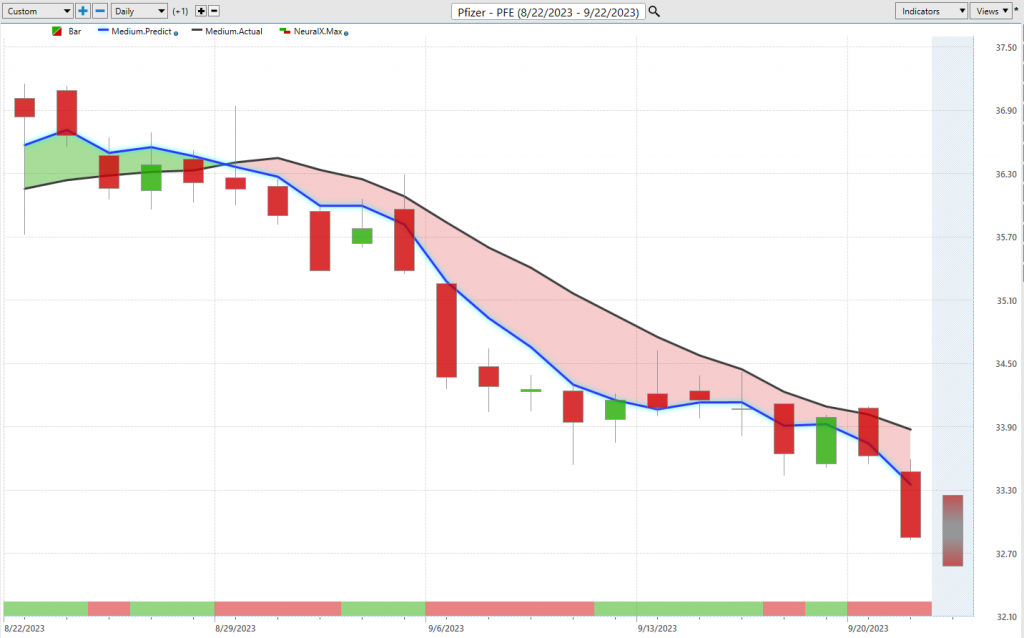
So what we have with Pfizer right, this is daily price action right? Each one of these candles that you see represents a full and complete trading day. And so it’s right up against all that price data. What you’ll notice is there is a black line value and a blue line value. So what the black line that you’re seeing there is, is actually a simple moving average. And this is a very common technical indicator. In this case, it’s a 10 period simple moving average. So it just adds up the last 10 Close prices, divides them by 10, that number essentially, and smooths out the existing price action.
Right, it lets us know where market prices have been over a given period of time. But Traders want to be ahead of that next move, right? If we’re getting weakness in the market, want to go ahead and sell that position or potentially get short. And so what we’re able to do is pay attention to the value of this blue line. And for that essentially price prediction, it’s a predicted moving average for that to generate its price prediction of where average prices are headed moving forward. This is where the technology of artificial neural networks come into play. And they’re performing what we would call inter-market analysis on shares of Pfizer. So that means that what these artificial neural networks are determined are the most influential markets that are known to drive and influence future price, specifically of Pfizer.
And so this can be things like ETFs within the biotech pharmaceutical space. This can be other individual stocks. This will be things like the S&P 500, the NASDAQ, things like the value of the dollar Index, which has been critical. If you go look at a dollar index chart, it is going straight up, and it’s causing a lot of pressure on shares. And so it’s able to take this global approach, even looking at global commodities like gold or silver or soybean futures, and understand how that’s affecting specifically the market that you’re trading. And so what it does, it looks at all of those competing market relationships, whether they’re positive correlations, inverse correlations, and it uses that to project future price going forward with a very high level of accuracy.
So whenever we see those global market relationships like the dollar heating up, like maybe these ETFs starting to soften, well, it’s going to affect shares of Pfizer. And we can see that we’ve really identified that while going to last week’s outlook, but really since August 29th, as we see that blue line crossed below the black line, and it’s indicating that those average prices are still expected to move lower. And so we can see that since last week, we’ve gotten an even more aggressive move lower here, but now off about 9.27 in 17 trading days.
And this is extremely important because why would I bring in Pfizer as a bearish opportunity last week? Well, because we were running sideways in the S&P, we had a very mixed market. And that really became very clear towards the end of Friday here. And so really nice move to the downside, but there’s other predictive indicators that can help Traders manage this position. And so if you look at the bottom of the chart, you see this bar that goes from green to red, back to green to red. Well, this is a predictive indicator utilizing that technology of artificial neural networks, but it’s only looking ahead short term. So two days strength or weakness over the next 48 hours. And so what you can see is this helps us with short-term price action. You see how it’s very bearish when we get this neural index or this crossover to the downside. The neural index gets bullish here, you get a little higher high over the next trading day, again here neural index gets bullish, you’re getting some higher highs. And what that often does is actually set up really nice opportunities to take advantage of Vantage Point’s predicted highs and lows.
So if you look all the way towards the right of the chart, you see this shadow candle here, and that’s actually a predicted high and a predicted low for the upcoming trading day that hasn’t yet occurred. And so what we do each week is we typically come and look at all of these predicted highs and lows. And if you’re trading Pfizer, you’ve got this road map that says, okay, the overall trend is down. I would, therefore, want to establish positions towards this prediction of where the high values are going to be for price that day. You see about five entries getting you an excellent position as this week we come in and we’re starting to see more weakness. Well, how can we identify that weakness and get ahead of it?
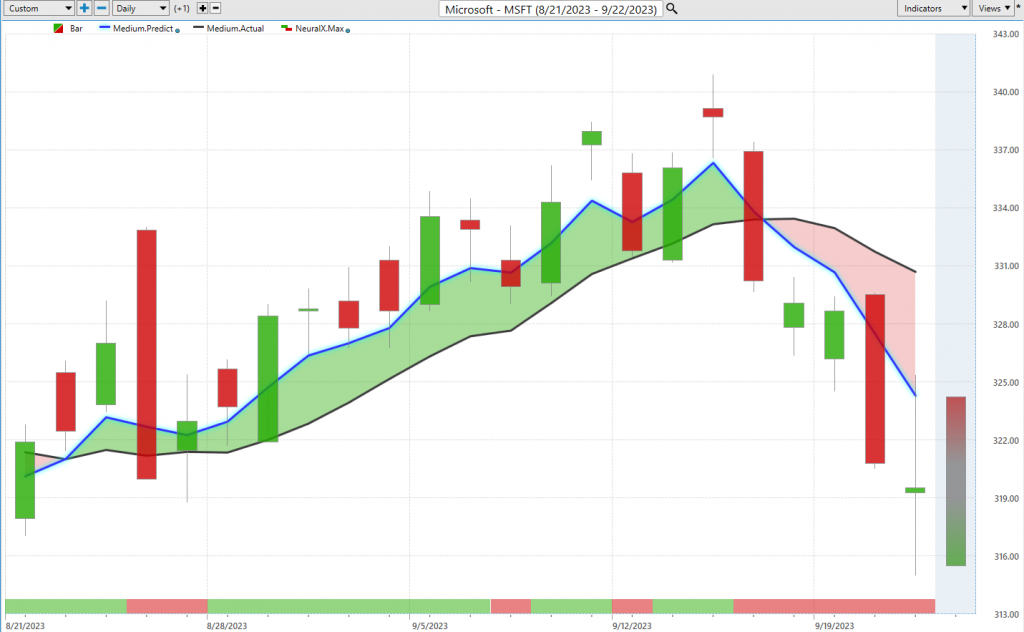
Well, oftentimes we can identify that through other markets. So Microsoft was one of these markets that last Friday, well, there’s been some strength, right? There’s certainly opportunities to buy some markets, and there’s been plenty of opportunities to get involved, trail your stops, and certainly make some money over the past several weeks of price action. But what we’ve seen more recently here is that Friday and then going into the week, you have a clean crossover to the downside. So even starting Monday, you understand that, hey, Microsoft, a market that really tracks the S&P in the broader markets pretty closely here, has just crossed to the bearish side. So we had a nice rally here where we had shares advance, but once that blue line crosses below the black line, you really need to get out of the way. And so you see about a 2-3% rally over that time and about 3 and a half percent decline just this week.
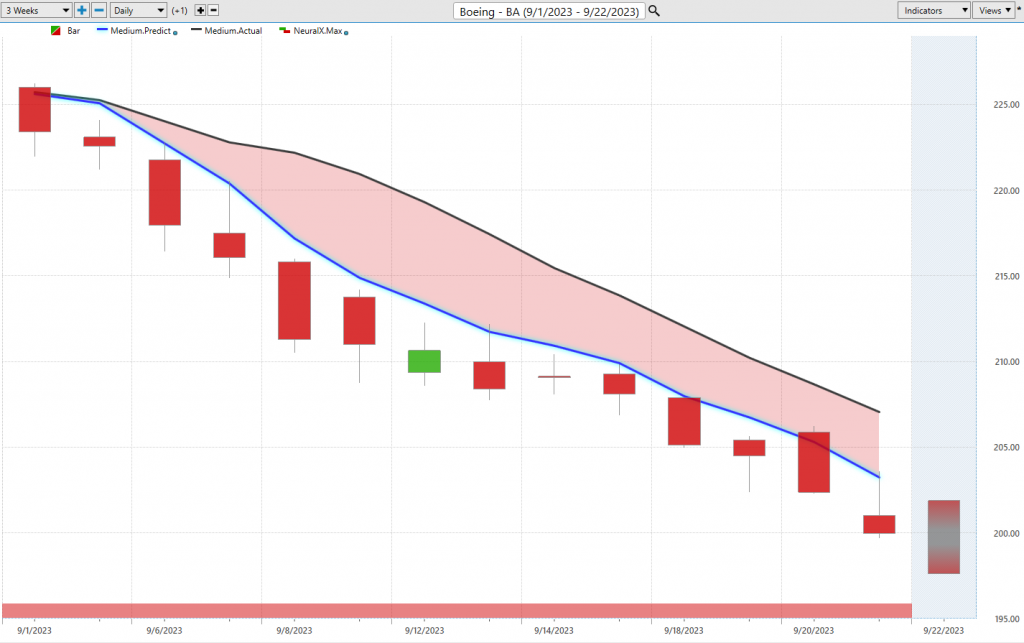
And so this is again why Pfizer, Microsoft, well, let’s look at Boeing, which was another one of these markets where we identified, hey, there is some weakness in the market. We want to hedge that portfolio, have things sort of mix, not just be completely bullish or be very light, potentially on the bullish side, and ready to cut those positions. But here you see *Boeing* very clearly, I mean, it doesn’t get more clear than this, that this is a weak market. Look at the past five trading days, you have not gotten one indication of strength from Vantage Point at all through any of its predictive indicators. And we see shares off another 4 and a half percent. So easy to identify where that weakness is coming into the market.
And but you know this happened a few weeks ago. And so as we start to see new fresh weakness come into areas, we really need to be aware here.
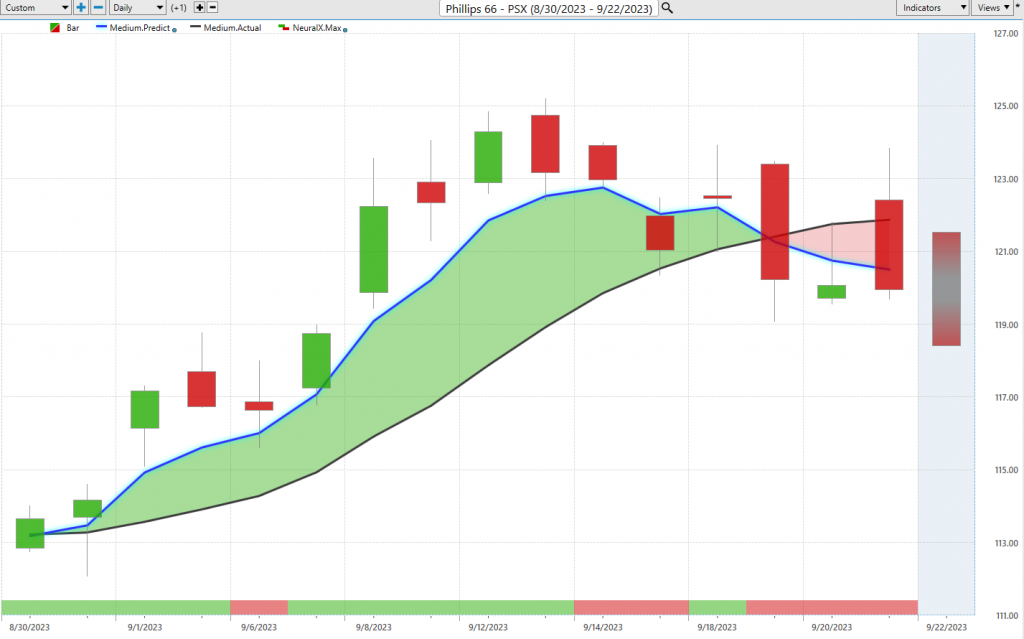
So here’s Philip 66 again, really nice opportunity on the bullish side. And as long as that blue line remains above the black line, well, great, the market prices are going to probably drift higher. We’ve got the help of our neural index and predicted highs and lows to guide us. But what have we seen this week? A lot of weakness from the neural index over the past, what is about, you know, five out of six trading days, you’re getting a bearish signal for that short-term forecast. And very clearly here, you do not want to mess around with Phillips 66 on the bullish side.
And let’s look at those most recent predicted highs and lows. And this is why I love these tools. As you see that, well, what happened after that crossover came through? Yeah, you got a gap up, but it gaps up, closes lower, and there’s certainly some weakness here in stocks and potentially here in the energy space with shares of Phillips 66, Uranium Energy, Corp.
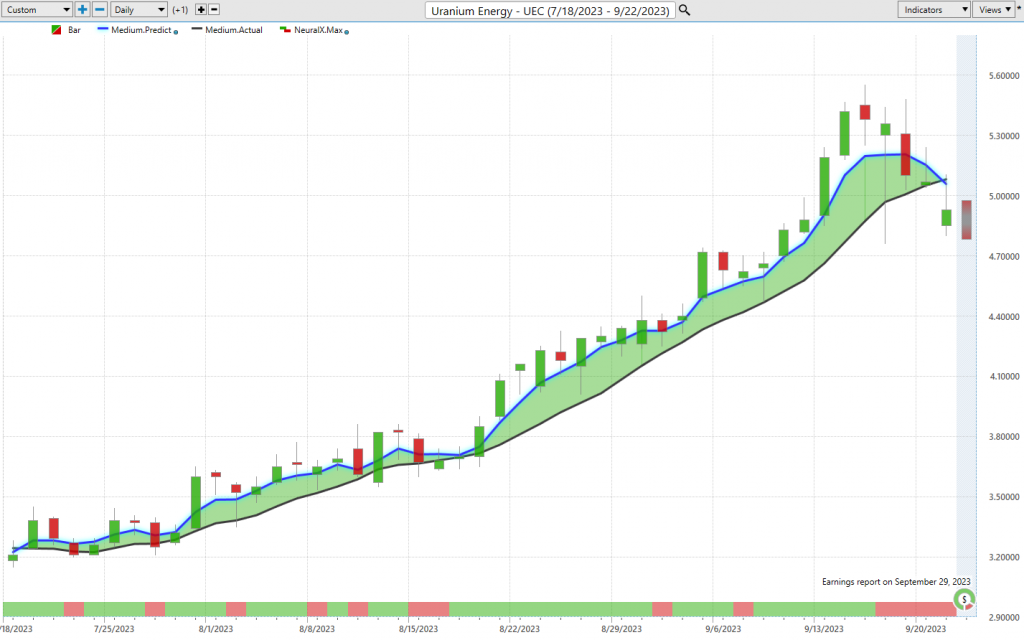
This was a huge opportunity that we looked at last week, but like I mentioned even early this week, week, you identify I mean really from Friday, you identify there is weakness here and it’s coming in pretty strong. You don’t really want to get caught up in this. So crossover to crossover, you see about a 54-55% rally over the past 46 trading days. But what have you seen from Vantage Point tools over the past five trading days? Bearish neural index all the way through here every single day leading into today. Neural index bearish, and we’re seeing that weakening of prices.
Very cheap stocks, you’re gonna need a lot of volatility here, but understand that look, take your 50-plus percent move on, maybe look to head to the market or adjust things, but we’re seeing some shifts in the marketplace, as seen by these things clearly in downtrend and more of these recent shifts. Pfizer, Phillips, uranium energy.
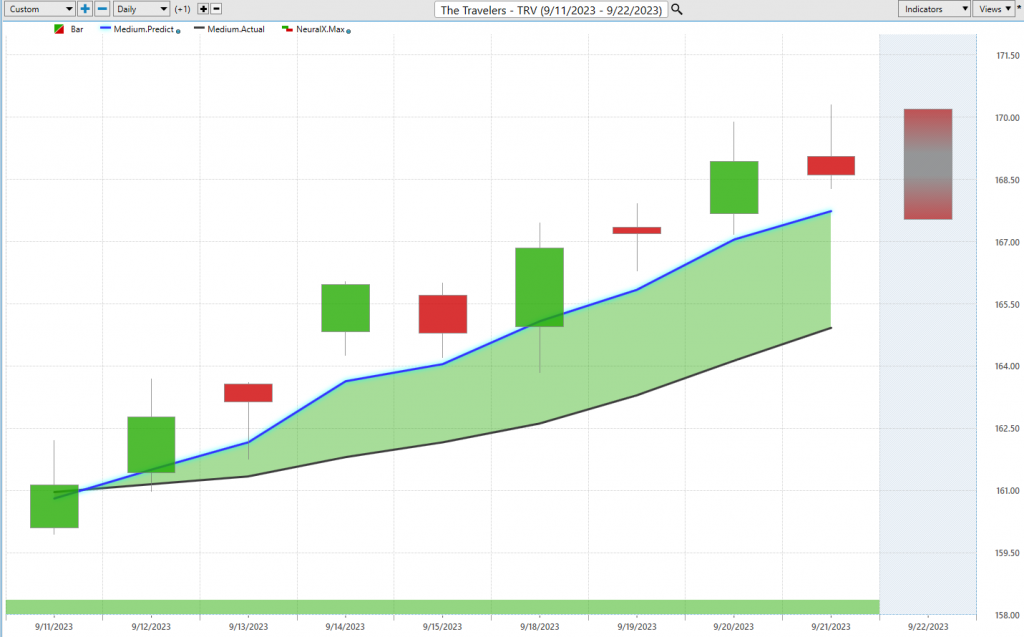
Here’s Travelers. And so this is again just highlighting why do I want to use these tools to identify trading opportunities? Well, they help you trade and manage the opportunity. So a couple of the bullish opportunities we looked at here were Travelers and Wingstop. And we see it in the case of Travelers when we can identify these shifts in the market at the right time, whether bullish or bearish, well, what were you able to do? Well, establish a position. And you’re at the point where you can lock in that position at break even if Travelers wants to start going lower here and sell off like the rest of the market. We’re not going to lose any money on this overall position.
And what you’ve been able to pull out of it, have you seen predicted lows being hit here? A lot of predicted highs to take profit, and still actually seeing some strength here, but the opportunity to lock in stops, be defensive if this wants to turn lower. You can take your profits and get out of the way.
Same concept here with Wingstop. Understanding that look, on the portfolio level, we’ve seen weakness come in this week, but as far as establishing the position, right, we identify the strength back here. And so what that allows traders to do is establish a position, do it at a very low-risk approach here. You see really nice entries, opportunities to take profit on the bullish side, and again, same things like we know that there’s some weakness and susceptibility in this market. And now you see you’re getting that cut lower, neural index bearish, but all these positions starting much lower on the chart than where we currently are.
And so really important time in the marketplace, right? We’re seeing some really interesting moves. We’re seeing things start to shift. And this is where Vantage Point tools can be extremely helpful in identifying potentially some of those strong bearish opportunities in the market, but also identifying these important shifts. And when you can see this with the help of Vantage points and telescan, not just on the market in question that you might be trading, but broadly across the markets, and seeing okay, is the S&P strong? Are we starting to see more of these stocks turn lower? More of these short-term indications get bearish? And that warns you as far as hey, what’s your trading style and approach? Well, you really need to be aware of this because things are going to start affecting your portfolio as volatility starts to creep into the market. So I’ll go ahead and leave it there. Once again, this has been our hot stocks outlook for September 22nd, 2023. Thank you all for watching. Best of luck out there, and bye for now.