


Register for a Free Live Training
The Hot Stocks Outlook uses VantagePoint’s market forecasts that are up to 87.4% accurate, demonstrating how traders can improve their timing and direction. In this week’s video, VantagePoint Software reviews forecasts for SPDR SPY($SPY), SPDR S&P 500 Semiconductor ($XSD), Las Vegas Sands ($LVS), Applied Materials ($AMAT), HIMS and HERS Health ($HIMS), IBM ($IBM), Cameco ($CCJ)
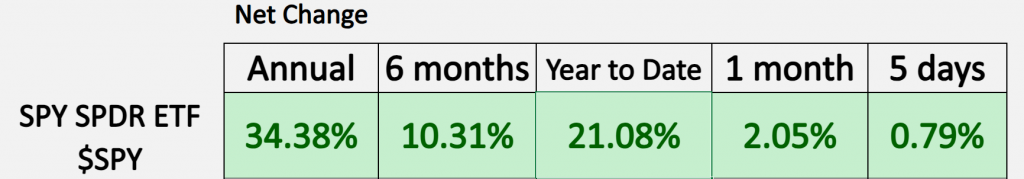
SPDR SPY ETF ($SPY)
VantagePoint A.I. Hot Stocks Outlook for September 27, 2024
Hello again, traders, and welcome back to the Hot Stocks Outlook for September 27th, 2024. Hope you all have had an excellent week out there in the financial markets. As always, today we’re going to take a look at the most recent Vantage Point AI predictive forecast. So if you haven’t already, make sure you go ahead and click on that link down in the description below and get yourself signed up for a live demonstration, so you can learn all the specifics about how these predictive technologies are helping traders make much better trading decisions out there in the marketplace.
Now, as we typically do, we like to take a look at the S&P 500 via the SPY ETF, and one thing that stands out is the general strength we’ve seen throughout the marketplace—up over 21% year-to-date. So, a really great year for equities broadly, but more recently, we’ve seen a modest return in strength from the NASDAQ Tech and, specifically, semiconductor stocks.
SPDR S&P 500 Semiconductor ($XSD)
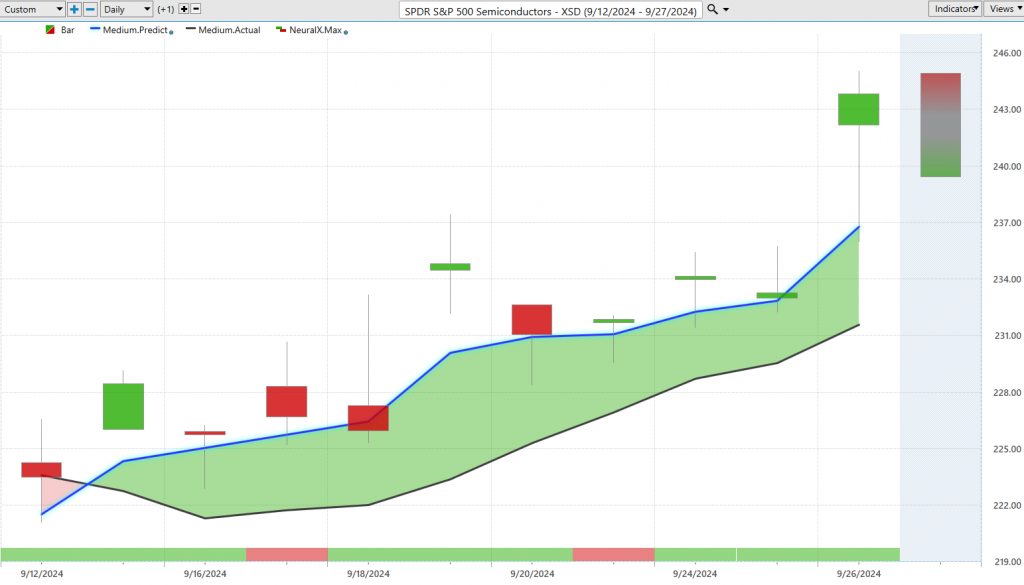
Let’s go ahead and start out here with the Vantage Point predictive forecast with the XSD semiconductor ETF to really highlight how all of these predictive indicators work together and how traders are getting ahead of some of these nice moves in price. What we have here is daily price action, right? Each one of the candles you see represents a full and complete trading day. You’ll first notice a black line and a blue line value.
The black line is a simple moving average, a common technical analysis indicator. In this case, it’s a 10-period moving average, which looks at the previous 10 closed prices, adds them together, and divides by that number to give us a rolling measure of where market prices have been. But the weakness here is that all of this information is from the past. It has no predictive capability and only looks at this market in isolation. It doesn’t understand how other markets are influencing future prices.
What Vantage Point traders can do is compare that black (lagging) moving average to the proprietary predicted moving average, which provides a future calculation of average prices moving forward. This is where the artificial intelligence and neural networks come into play. They’re performing intermarket analysis, meaning they understand how related markets will drive and influence future prices for XSD.
The AI is analyzing those markets—whether they be leading, lagging, positive, or inverse correlations—and then generating highly accurate predictions of where prices are likely to go. This can include the S&P 500, NASDAQ, other ETFs, individual stocks, and global commodities, currencies, or interest rates, depending on the target market.
So, when we see this blue line cross above the black line, it suggests that average prices are going to start moving higher. You may want to take long positions or express your trading strategies in a bullish way. Over the last nine trading days—about two full weeks—you’re up about 8% in the ETF, meaning individual semiconductor stocks have seen much higher returns.
Looking at the bottom of the chart, you’ll see a green bar that alternates between green and red. This is another predictive indicator, tuned for short-term (48-hour) strength or weakness. When we see the neural index go bearish during an uptrend, we tend to get short-term weakness, and you can see a bit of selling on this trading day. However, the overall trend remains upward, as indicated by the distance between the blue and black lines.
Lastly here, you’re provided a predicted high and a predicted low, so you’re getting the overall trend direction, short-term strength or weakness, but also an intraday measure of the total range for the day. Every week, what we do is we look back at these previous predictions and see, okay, well, how accurate are all of these predictions before the trading day actually occurs? We can see that once this crossover came through as far as our predicted moving average, it’s highlighting that we should look down toward this predicted low for the market to trade. You see, suspiciously, we push a little bit lower, but look where that market closes and then immediately trades up toward what was that predicted high for the next trading day. This is where short-term traders can take little pieces out of the market, but also trend traders can get excellent entries in the overall move.
We start to see that volatility pick up, see a couple of more days here before we get the next rally. As far as the market moving down toward those predicted lows, getting very close here, but you see three, almost four entries in this uptrend, allowing traders to really recognize that semiconductors are strong. Maybe if you’re looking at timing some of those semiconductor stocks, well, when the ETF is down at its predicted lows and the market’s depressed, well, it’s a great opportunity to get involved.
This has led to a lot of opportunities throughout the tech space, specifically semiconductor areas, and some really nice rallies here.
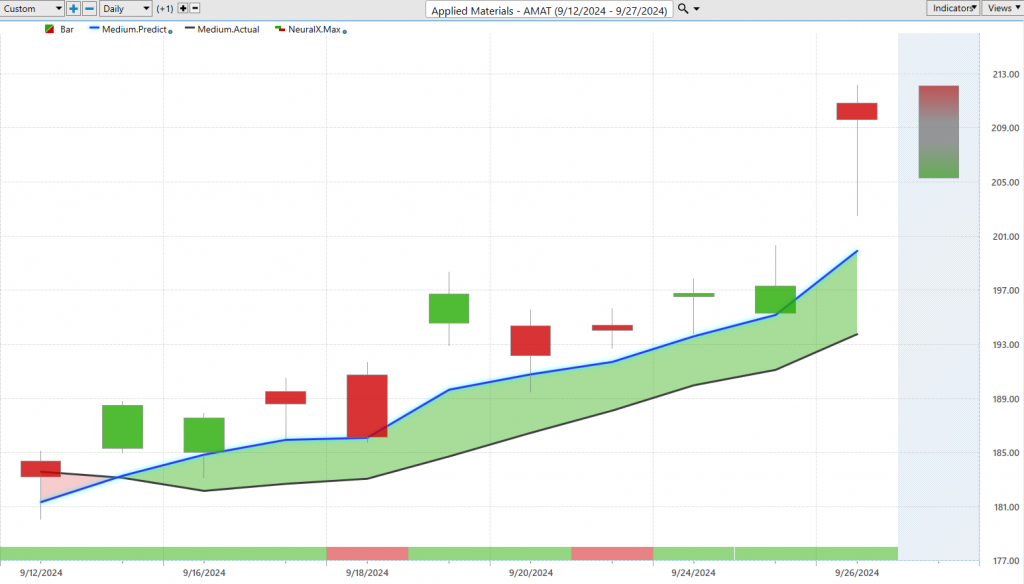
So here, shares of Applied Materials, a very similar forecast. We get that blue line crossing above the black line, neural index bullish going into this, forecasting strength at the start of this move. You see, you get these little blips where the market again tends to run sideways, but as that neural index corrects itself and has an extremely high level of accuracy upwards of 80% across a very wide number of markets via the neural index, this is what helps traders make the most of these short-term opportunities. Of course, we can look at these predicted highs and lows. You get the same forecast and say, hey, look, have orders waiting down at this limit. Well, you’re actually going to get filled at the open here. You see almost perfectly hitting that predicted low before a gap up and a move, a little bit of volatility here around the weekend. We see this all the time. Right around the weekends, you get a little bit more volatility and illiquidity in price, but the overall trend moving higher. Really, just this past week from Friday to today here, you’re looking at about a 9%, almost 10% rally here in shares of Applied Materials, and just across the tech and semiconductor space more broadly here. So really nice move here in shares of Applied Materials, about a 13% rally just over the past nine trading days.
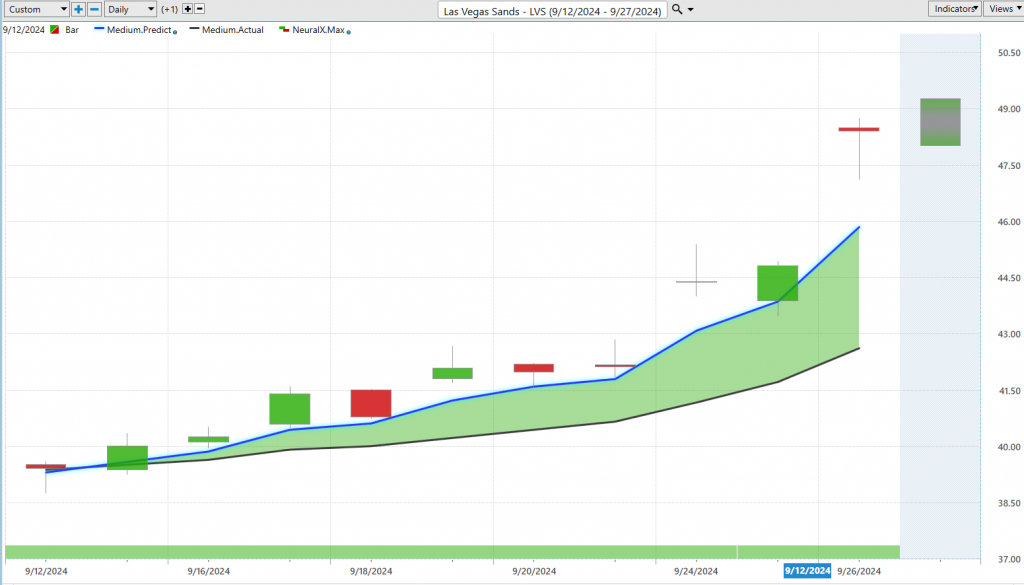
Moving into a different area of the market, here’s Las Vegas Sands. So we’ve actually seen a lot of the Chinese stocks that have been depressed, you know, China’s having problems with its economy, but a lot of these stocks were really pushed down, and we’re really seeing a reversal here. So here you see this blue line crossing above the black line, and look at the neural index here, just forecasting complete strength every single day for the past couple of weeks here, and this creates opportunities for traders to say, okay, well, where can I get some good prices today to get involved in this uptrend? You see you get pretty close to a day here, definitely hitting there, hitting there, gap down, and then the resumption of the trend. This has been a really nice rally here in shares of Las Vegas Sands, and you’re actually seeing the market gap up here and continue, so about a 21%, 22% move just in the past 10 trading days there on shares of Las Vegas Sands.
Again, what I want to highlight here is how things like the predicted neural index forecast short-term strength, and it’s pretty much every single day saying, look, expect higher prices. You’ve pretty much got 100% accuracy there as every single day the market goes higher. This is, again, where that accuracy comes from. It’s very rarely going to be wrong. Accuracy is correct upwards of 80% across a wide range of markets, and so you can really tie that into your overall expectations of the market, the overall trend, short-term strength or weakness, and then go in with those predicted levels and execute your trading strategies.
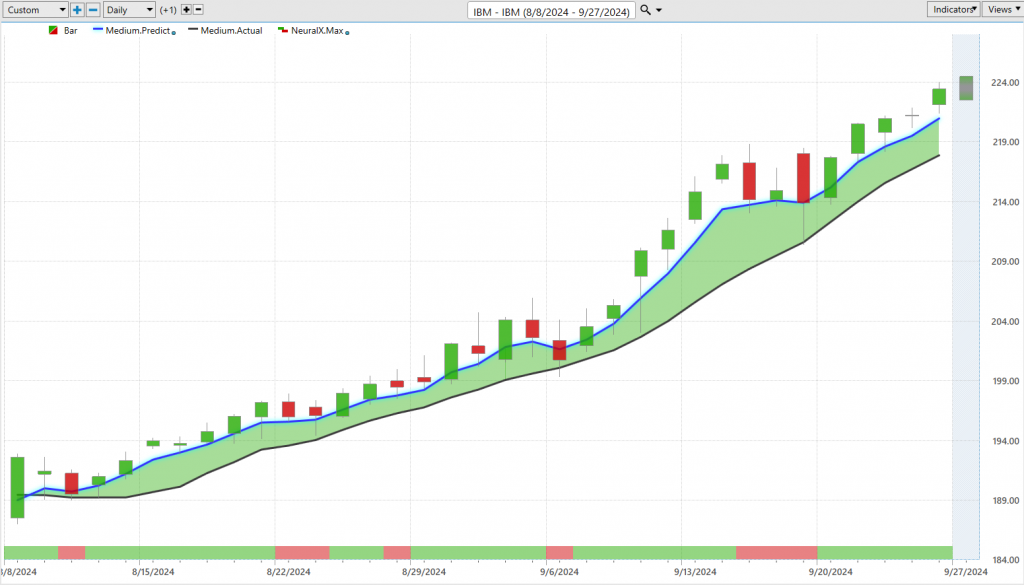
Here, shares of IBM, so a little bit back to the tech space, but this is something that we looked at, you know, really a couple of weeks ago here. Just wanted to update the forecast, and so this is an area where, even with all that volatility in the markets, this has been in a consistent uptrend, and you don’t want to get out of trades that are working. So when we look back and say, well, how accurate are all of those predicted highs and lows, really just over the past couple of weeks, you see, look at this, moving down to the predicted low. Here we get a little bit of volatility, scooting lower, but very clearly the trend is up, and even this being Tuesday for the week moving in, benefiting off of the broad-based strength that we’ve seen throughout really broadly the equity space but again specifically around these tech stocks. So this takes IBM now up over 17% just in the past 34 trading days, but what’s more important about that is how many entries along the way here. So if we look at all of these predicted high and low ranges as their individual predictions or forecasts, well, how many days do you get a really excellent forecast to benefit you, not only for the overall trend and getting a nice entry but even some short-term trading just to make some money for the week? Like, you know, this past week we moved down, scoot up, and then really rinse and repeat here, so really nice move there out of IBM and a good example of where you might see that general volatility in the market. Vantage Point does a great job of skewing to the bullish side and saying, no, look, the overall trend here is up. We may get these periods of consolidation and sideways, but you’re not getting that crossover of the blue line moving below the black line.
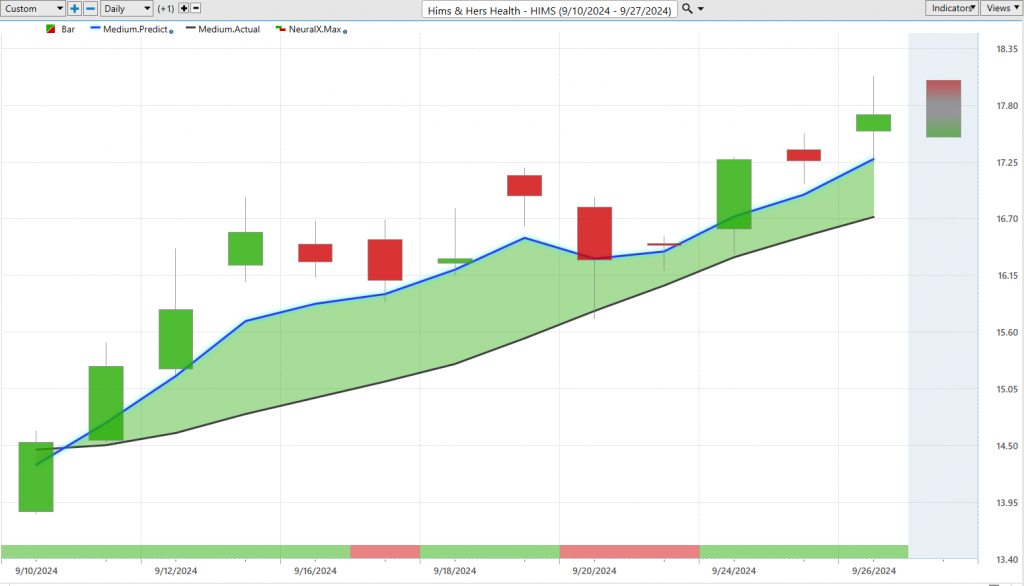
Now, last week we also looked at Hims and Hers Health, and this is a really good example of just how things work over weekends here. So we had this blue line crossing above the black line, and what we highlighted were some of these predicted lows that had previously been hit. You see, well, what happens here on Friday in the session? Well, you’re moving down to some of these previous predicted low levels after you get all this illiquidity. So when you get these days where you’re gapping outside of the range, you can usually expect higher levels of volatility in the market. Sure enough, if you’re ready to buy on that dip, well, you get an excellent entry as this week shares have performed extremely well. So if we look at just the past week here, shares up another 9% in the past five trading days, and overall, you know, this move has been about an 18%, almost 20% move as the overall trend just continues to move higher. You see about 18% there in just the past 12 trading days, so really nice opportunity there in Hims and Hers Health.
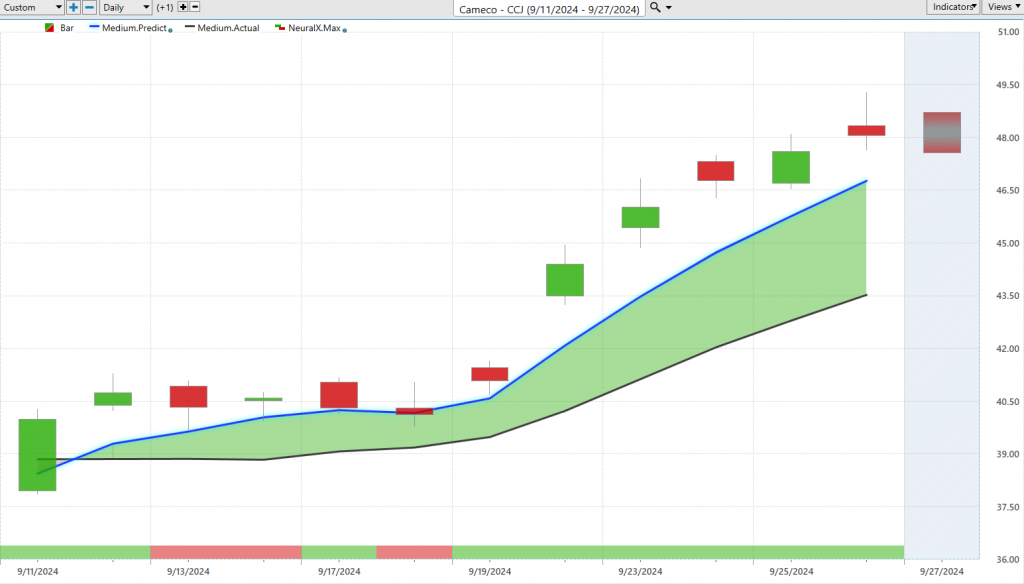
Lastly here, you know, nuclear energy producer, I think in uranium mining and all that, so all these different areas, whether it be tech stocks, resorts and gambling, pharmaceuticals, but here in Cameco (CCJ), you see that blue line crossing above the black line, and here’s a really good example of how the neural index works. So you see that neural index goes bearish, and what it’s warning you, again, is that subsequent short-term weakness over these 48-hour periods. So that can warn traders and let them know, look, if you’re involved in the uptrend, don’t be surprised to experience some weakness here over the next couple of days. It may even offer some good opportunities to buy down at those advantageous levels, like the predicted low. Once the trend starts to pick up again, you see that neural index gets bullish, and that momentum is just persisting in the marketplace. So really nice move here in shares of Cameco (CCJ), really seeing some early acceleration here and gap-ups, about a 20% move in just the past 11 trading days.
Really, almost wherever you look, you’re seeing really nice, strong forecasts but being able to really minimize the risk, get really nice entries, and really recognize all of the strength that we’ve seen throughout the tech space and, again, specifically semiconductors. So when you have the forecast for things like the ETFs, you can really see the whole sector start to move, understand, hey, where should that focus be? Well, now I can go look at semiconductor stocks or trade the ETF and make sure you’re around for this really nice rally we’ve seen over the past 10 or so trading days, really just the past couple of weeks here.
So we’ll go ahead and leave it there for today, but once again, this has been our hot stocks outlook for September 27th, 2024. Thank you all for watching, best of luck, and bye for now.


