Register for a Free Live Training
The Hot Stocks Outlook uses VantagePoint’s market forecasts that are up to 87.4% accurate, demonstrating how traders can improve their timing and direction. In this week’s video, VantagePoint Software reviews forecasts for SPDR SPY($SPY), McCormick and Company($MKC), Shake Shack($SHAK), Meta Platforms ($META), Unilever($UL), Yum! Brands ($YUM).
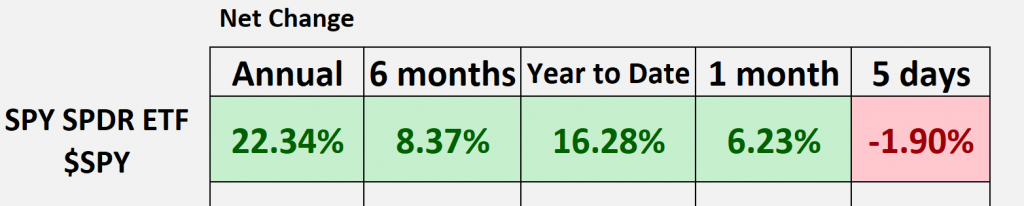
SPDR SPY ETF ($SPY)
Hello again, traders, and welcome back to the Hot Stocks Outlook for September 6, 2024. I hope you all had a nice week out there in the financial markets. As always, we’re going to take a look at the most recent Vantage Point AI predictive forecast. If you haven’t already, make sure you go ahead and click on that link in the description below, and you can sign yourself up for a live demonstration to learn a lot more about how these predictive technologies are helping traders make much better trading decisions out there in the marketplace.
As we typically do, we’d like to take a look at SPY or the S&P 500 ETF. What we can see here is that, actually, over the past 5 days—and you know we had the Labor Day holiday, so it’s sort of a short week from the last Hot Stocks Outlook—we’re down about 1.9% over the last five trading days, and we are starting to see volatility pick up. Last week, we recently came close to those all-time highs in the S&P, and now we’re starting to dip back lower, so you really want to be careful out there. This is where Vantage Point’s forecast can really help traders identify safer places to trade and also how to manage those opportunities as we progress forward through time.
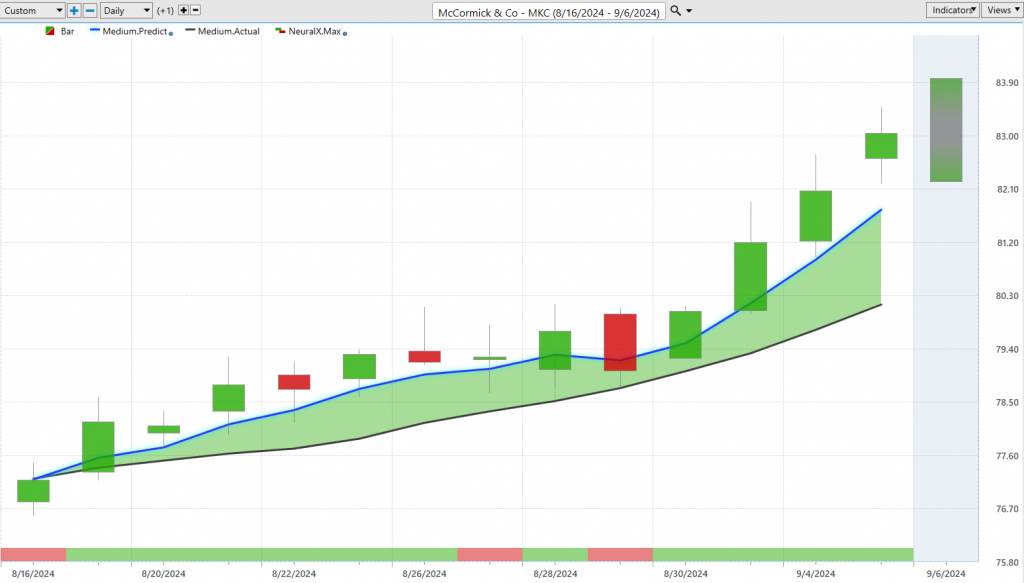
A really good example of how all of these predictive indicators work together is in shares of McCormick and Company ($MKC). What we have here is daily price action. Each one of the candles that you see there is going to represent a full and complete trading day. Right up against that price data, what you’re going to first notice there is a black line and a blue line value. The black line that you’re seeing is actually a simple moving average, a very common technical indicator. In this case, it looks back at the previous 10 closed prices, adds them all together, and then divides by 10, and you get a rolling measure of where market prices have been. That acts as a good baseline, letting us know, ‘Okay, where have prices been?’ But technical analysis tools like that are always going to lag behind the market and really just summarize what already has occurred in the market because it’s really just being pulled from those close prices that, of course, have already happened.
What we’re able to do is compare what we might call that lagging moving average to this Vantage Point proprietary predicted moving average. For this number, essentially a calculation of future prices, for that to get calculated and plotted on the chart, well, this is where the technology of artificial neural networks come into play. They’re performing what we would call intermarket analysis. So, what that means is, specifically for the target market—so in this case, McCormick—it’s going to look at markets that are known to drive and influence the future price of these shares. That can be things like big ETF groups, that can be things like other individual stocks throughout the marketplace, and you have to understand that some of these things share inverse relationships, positive correlation, some of these relationships are leading or lagging, and that’s where the effectiveness of neural networks is able to analyze this information and then incorporate that into these robust forecasts.
Whether it’s in the ETF or stock side, or even all the way into things like currencies, global interest rates, and even global commodities which may affect again that target market that you’re trading, all are taken into account to create an assortment of predictive indicators. What we’re highlighting here is this predicted neural index or this predicted moving average, rather. So when it gets above that black line, it’s signaling the overall trend is starting to move higher. Now, towards that predicted neural index that I mentioned, well, that’s what you see here at the very bottom of the chart, and this is another indicator that is tuned to solve a different problem than our predicted moving average, which highlights the overall trend. The predicted neural index, you see this bar that will go from green to red back to green. Well, this is updated every single trading day, and what it’s doing is forecasting short-term strength or weakness over the next 48 hours. So whatever you see at the right-hand corner here is that projection of short-term strength or weakness over that next 48-hour period. And this is where we see how accurate a lot of these short-term forecasts are. You’ll notice that when the neural index is green, we get a consistent rise higher in price. But as that shifts to a red configuration or bearish mode, you see that prices actually run sideways, and you get a little bit of selling before things correct, and we start to see that momentum pick back up in the market. So this is where shorter-term traders can really use this to guide you know whether they want to be buying or selling.
Really, to round out the entirety of these predictive indicators, well, you’re also provided a predicted high and a predicted low. So when you understand a little bit about neural networks, well, all of these indicators have a really different set of neural networks trying to solve these different problems of the overall trend direction, short-term strength or weakness, all the way down to these predicted high and low ranges that are provided for the trader. That really rounds out this series of indicators to round out that forecast.
And so if I hit F5 on my keyboard here, we can actually go and look and see how accurate all of those predictions were once the actual market data filled in, really that blank there. And so you see, once you get that overall trend to the upside, well, you can start looking towards these predicted lows for really nice entries into an uptrending market, and you see even on the bullish side where we hit these predicted highs, and the market tends to push lower. So this is what’s allowing traders to get involved, reset their position at better prices, and make the most out of these trading opportunities when they come up in the marketplace. So we see about a 6 and a half percent rise just over 10 trading days in this particular stock, but of course, the forecast can change. And so this is why we always want to look at the most recent forecast to help make those adaptations and adjustments to our overall trading strategy and position sizing.
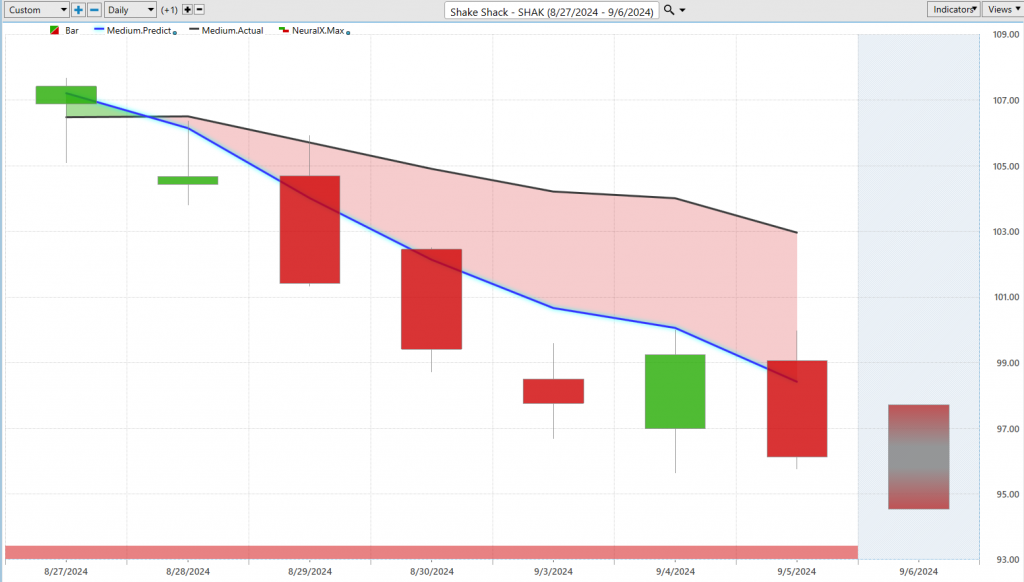
Now we are seeing again an uptick in volatility. Right, it’s not just a straight shot; we’ve had certain times in markets where almost everything’s moving higher. Here, shares of Shake Shack ($SHAK)—again, a good example of highlighting that. Look at the neural index at the bottom here, pretty much every single day, signaling, ‘Look, expect that market price to start moving lower over the subsequent 48-hour period.’ And um, you know, this works over a very large number of markets, right? So when you’re leaning on this tool, it has a very high level of accuracy, upwards of 80 plus percent, but we can really fine-tune this with the other predictive indicators that we’ve highlighted. So once we see that trend shifting to the downside, neural index bearish, of course, really short-term traders can say, ‘Okay, well, where exactly do we want to look for the overall trading range to play here over the next couple of trading days?’ And you can see how accurate all these levels are, indicating that really right after that trend shift came in, look, if you get up towards these predicted highs, you want to short, and be ready to take profits on short positions to go ahead and make some money. So actually, four entries there as the overall trend and price goes lower here in shares of Shake Shack. So overall here, seeing about an 8% decline, almost 9%, just in the past five trading days. And so this is why this is very important to understand where these shifts are happening, where to avoid, or potentially where to hedge your portfolio and actually take some short positions in the market. Really popular stock, here’s Meta Platforms ($META).
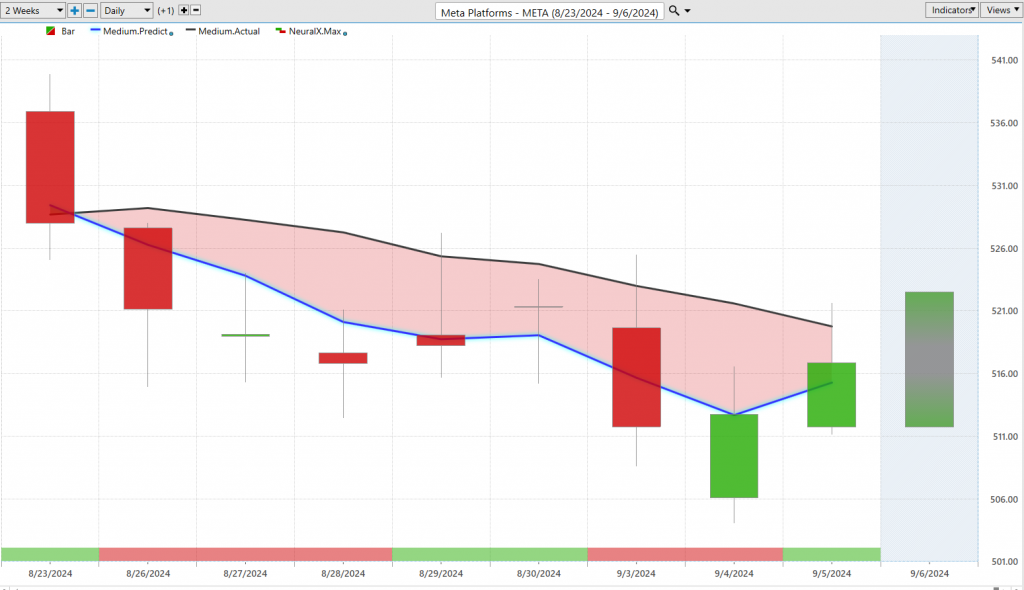
So, over the past couple of weeks, well, what have we seen? Well, the blue line below the black line. You see that your neural index gets bullish here, and you actually get a couple of days of subsequent bullish price action. But look at that distance between the actual moving average and the predicted moving average, very clearly in a downtrend. So when we see a lot of big, important stocks looking bearish like this, well, you can sort of tap the breaks a little bit, uh, and really wait for things to line up in these predicted moving average crossovers to get back to the bullish side. Then we can look at those predicted high and low ranges, and again you see really at the end of last week, the beginning of this week, this being Monday, saying, ‘Look, if you want to take a position, look to short, take profits on shorts.’ And that’s pretty much been the case, uh, as shares go lower, and we’re seeing the indices move a little bit lower here on Friday morning.
Here, shares of Unilever ($UL)—so really the inverse here, right? You see the blue line crossing above the black line, a lot of strength from the neural index, a little bit of blip here where you run sideways, and then getting back to bullish. But uh, clearly a stronger trend here, uh, and over the past couple of weeks, highlighting down to the individual trading day, you know where you might want to look to take positions, uh, get nice entries as the market continues to trade higher. So nice move there in shares of Unilever. We can take a look at the overall distance of the move here. Uh, now over the last 13 trading days, about a 7% increase in shares of Unilever.
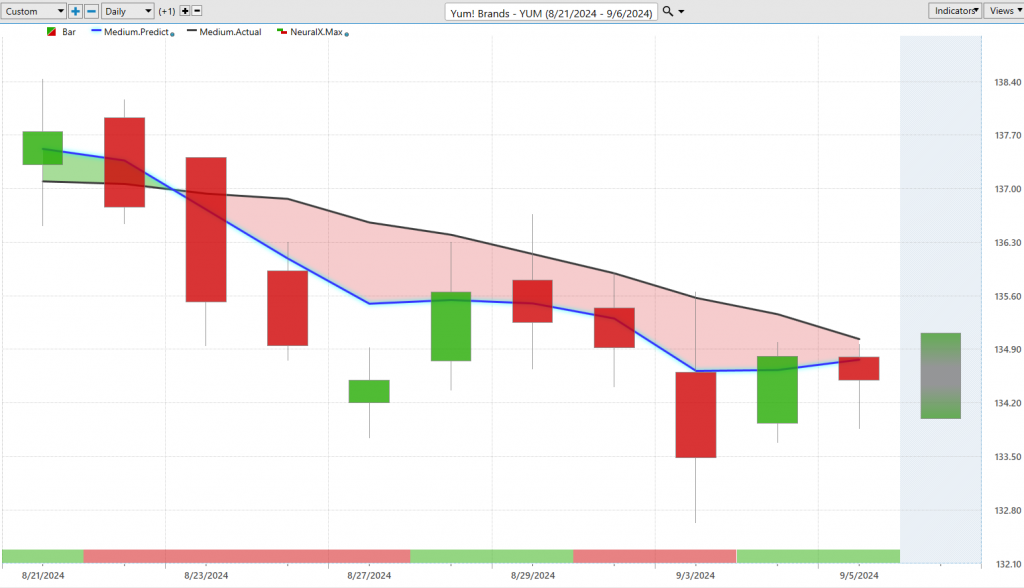
Lastly, here, I wanted to highlight Yum! Brands ($YUM),
and I really just wanted to get both sides of this because we do have things shifting. And so we looked at, you know, shares like BioGe, one of the biotech stocks last week, actually last two weeks, showing the rise up, but then also showing that shift. And so that’s where you see a lot of these crossovers moving to the bearish side. You want to go ahead and uh, you know, adjust your position. Notice how when the blue line is above the black line, the neural index is bullish. You know, this is really the range where you want to come and be a buyer, right? So look towards the Vantage Point predicted highs, or uh, predicted lows rather, uh, to scoop up a position and uh potentially take some profit. So you see here, really nice entries when the market is down in that uptrend. But notice how things start to shift—one from the neural index, indicating at the very least, look for the market to move down towards these predicted lows, but also with the crossover to the downside, indicating that, okay, well now the trend is really shifted here, uh, and you may actually want to go ahead and short the market. Right, so if doing anything, look to get out of the market up at these predicted highs, potentially short at those levels. That’s where we’ve seen a lot of volatility start to creep into the broader market here. So uh, again, highlighting a place where you might want to avoid, um, and waiting again for those crossovers to get back to the bullish side, uh, highlighting some opportunities like McCormack here and Unilever, where you see those strong trends, both in the overall trend direction from the predicted moving average but also the neural index and those predicted highs and lows moving higher to help guide your trading decision.
So uh, we’ll go ahead and leave it there for today, but once again, this has been our Hot Stocks Outlook for September 6, 2024. Thank you all for watching, best of luck, and bye for now.