FORECASTED MOVING AVERAGES – LEADING INDICATORS SOFTWARE
By Louis B. Mendelsohn
Moving averages are one of the most popular and widely-used technical indicators, helping traders identify the trend direction of markets. Moving averages form the basis of a myriad of single-market trend following trading strategies, ranging from the popular 4-9-18-day moving average “crossover” approach to the widely followed 50-day and 200-day simple moving averages used to highlight the underlying trend direction of broad market indexes and individual stocks.
Moving averages, calculated according to precise mathematical formulae, are an objective (quantitative) way to ascertain the current trend direction of a market, and formulate an expectation about its future direction. Moving averages filter out the random “noise” in past price data by “smoothing” or “averaging” out the fluctuations in price movement. However, traditional moving averages have one very serious deficiency. They are a ‘lagging’ technical indicator. This means that moving averages, due to their mathematical construction (averaging prices over a number of prior periods) tend to lag behind the current market price.
Making trades based upon the analysis of moving averages typically result in getting into and out of the market late, compared to the point at which the market’s price actually makes a top or bottom and changes trend direction. Depending on the market’s price movement, and the type and size of moving average utilized, this lag effect can be substantial, causing the difference between trading success and failure in today’s highly volatile, global financial markets.
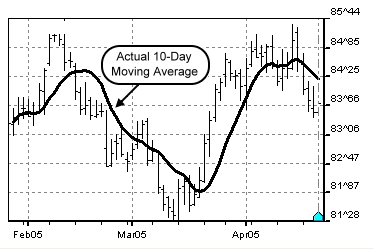
Figure 1 below depicts a chart of daily prices of the U.S. Dollar Index futures contract, with its actual 10-day simple moving average. Notice how the moving average lags behind the market at major turning points.

Figure 1: Daily prices of the U.S. Dollar Index with its actual 10-day simple moving average.
(Source: VantagePoint Intermarket Analysis Software)
Moving Average Crossovers Lead to Whipsaws
This lag is the Achilles’ heel of moving averages. Technical analysts have spent years on research in a futile effort to eliminate it, while still retaining the beneficial “smoothing” effects of moving averages. As a result, numerous types of moving averages have been devised, each with its own mathematical construct and effectiveness at discerning the underlying market trend and ability to minimize the lag effect.
Moving averages are often incorporated into more complex technical indicators, such as moving average crossover strategies in order to improve their effectiveness. One such approach, involves two simple moving averages of different lengths, such as a 5-day and a 10-day average. When the short moving average value is greater than the long moving average value, the underlying trend is assumed to be up. When the short moving average value is less than the long moving average value, the trend is assumed to be down.
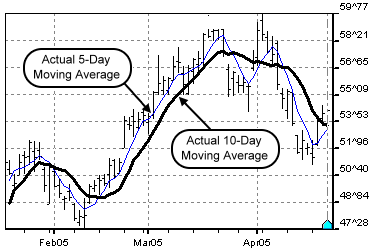
Figure 2 shows the New York Light Crude Oil futures contract with its actual 5-day and 10-day simple moving averages superimposed on the daily price chart. Notice how the short average is more responsive than the long average, but that both still lag behind the market at major turning points.

Figure 2: Chart of daily prices of the New York Light Crude Oil futures contract with its actual 5-day and 10-day simple moving averages.
(Source: VantagePoint Intermarket Analysis Software)
An inherent assumption behind moving averages is that once a trend is underway, it tends to persist. Therefore, until the long moving average is penetrated by the short moving average, for instance, in the direction opposite from the prevailing trend, the trend is assumed to remain intact.
Traditional moving average crossover strategies are effective at identifying the current market direction in strongly trending markets. But, in non-trending, sideways markets, and even in trending markets when using very short moving averages which may be overly sensitive to abrupt price fluctuations, these approaches are subject to whipsaws. This results in erroneous trading signals at market tops and bottoms. So, while traders can make money in trending markets using moving averages, it is the choppy markets, increasingly more common today, that can cause substantial trading losses.
Various crossover strategies have been created in a further effort to overcome this deficiency. One popular approach compares an actual price, such as the daily close, with a moving average value. Other commonly-used approaches attempt to minimize whipsaws and filter out faulty signals by using bands surrounding the moving averages, utilizing three or more moving averages, or combining moving averages with other single-market technical indicators for additional confirmation.
With today’s unprecedented intraday and interday market volatility, caused in no small measure by the globalization of the markets and resulting effects of related markets on one another, one can no longer rely solely on single-market lagging indicators such as moving averages. Moving averages always lag behind turning points in the market. Now, knowing that a market made a top or bottom several days ago is no longer an effective way to make trading decisions, if it ever was. Even a one day lag, in today’s fast-paced, globally interconnected markets, is too long to wait for this information.
It is imperative that traders adopt an intermarket perspective and incorporate intermarket data into their current trading strategies, in order to develop effective leading indicators that correspond to how today’s global financial markets really exist.
A New Way to Forecast Moving Averages
The purpose of technical analysis is to identify the underlying market trend and forecast (or at the very least extrapolate) its future course, for the purpose of making profitable trading decisions. Therefore, it seems logical that this goal could best be achieved through applying leading indicators which utilize both single-market and intermarket data, rather than by continuing to rely upon trend following indicators such as traditional moving averages that are computed solely on past single-market data.
Theoretically, a predicted moving average value for a future date, if it were 100% accurate, would have, by definition, no lag whatsoever. Since this is impossible, something else must be done to bring this widely-used trend following indicator into the 21st century of trend forecasting.
One innovative solution to this dilemma transforms moving averages into a leading indicator by using both single-market and intermarket price, volume and open interest futures data as inputs into the design of neural networks which are then trained to make short term forecasts of moving averages.
Neural networks are a mathematical technology from the field of artificial intelligence, which can be trained to find reoccurring patterns and relationships within both single-market and intermarket data, applicable to market forecasting. These forecasted moving averages are then incorporated into predictive moving average crossover strategies that identify market trend direction of individual financial markets with very high accuracy.
For instance, to forecast the short term trend direction of the 30 Year US Treasury Bonds for the next several days, neural networks can be trained on past single-market data on the 30 Year US Treasury Bonds itself, in addition to intermarket data from various related markets. Sophisticated software can be used to analyze related markets to forecast several moving averages of different lengths and of different forecast time horizons on the 30 Year US Treasury Bonds. This could include a 5-day average for two days in the future and a 10-day average for four days in the future. The related markets would include the 10 Year US Treasury Notes, U.S. Dollar Index, Euro FX, Comex Gold Index, S&P 500 Index, Japanese Yen, Eurodollar, Bridge/CRB Index and New York Light Crude Oil.
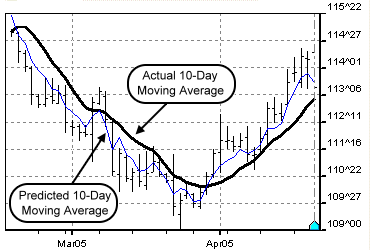
Figure 3 shows a crossover of a predicted 10-day simple moving average for four days in the future with today’s actual 10-day moving average for the 30 Year US Treasury Bonds. Notice that the predicted moving average, because it is forecasted in advance, does not lag behind the market, while the actual 10-day average lags behind both the market and the predicted average.

Figure 3: Chart of daily prices of the 30 Year US Treasury Bonds with a 10-day predicted and actual moving average crossover.
(Source: VantagePoint Intermarket Analysis Software)
Each day as the neural networks are updated with the most recent single-market and intermarket data, new moving average forecasts are made and the difference in value between each predicted and actual moving average of the same length is determined.
In this simple example, when the predicted moving average crosses the actual moving average from above to below (the difference goes from positive to negative), the market trend is expected to turn down within the forecast time horizon.
When the difference reaches a maximum negative value and starts to narrow (indicating that the downward trend is beginning to lose strength), this is an early warning that the market is poised to make a bottom and turn up.
Rather than wait for the crossover itself to occur, trading decisions can be based on a narrowing in the difference. For instance, when the difference reaches a maximum negative value and starts to narrow, you can act on this information in a number of ways depending on your account size, risk propensity, trading style and objectives. Here are just three possible scenarios that can be pursued (assuming that you are in a short position):
-
If the difference reaches a maximum negative value and narrows by even a small amount, you can close out your short position and stand aside. Then you can wait for the difference to narrow further before going long.
-
If the difference reaches a maximum negative value and narrows by even a small amount, you can tighten your stop and stay in your short position until the next day.
-
If the difference reaches a maximum negative value and narrows by a minimum amount, you can close out your short position and go long. This strategy is the most aggressive of the three since it involves reversing positions at the earliest indication that the current market trend is expected to make a bottom and change direction.
There Is No Financial Crystal Ball
By employing leading indicators, utilizing both single-market and intermarket data, such as forecasted moving averages, early warnings of imminent changes in trend direction become apparent days before they show up on traditional price charts or can be identified by single-market trend following indicators which lag the market.
Admittedly, it is impossible to create leading trend forecasting indicators that can forecast future market direction with 100% accuracy. This elusive Holy Grail is the financial market equivalent of a desert mirage. In reality, no more than 80-85% predictive accuracy can ever be achieved, given the randomness and unpredictable events that are inherent in today’s globally interdependent financial markets, as well as due to the daunting task of creating effective forecasting tools that can stay current with rapidly evolving, complex financial markets.
As the futures and equities markets become even more intertwined and more traders incorporate intermarket analysis into their trading strategies, powerful leading indicators, such as the predictive moving average crossover strategies briefly discussed in this article, which expand upon the concepts of popular trend following indicators, are a must for serious traders. This will allow them to seize trading opportunities based on predictive information derived from the hidden relationships and complex patterns between related global markets.
About the Author
Louis B. Mendelsohn is president and chief executive officer of Market Technologies, a trading software development firm founded in 1979, that specializes in the use of intermarket analysis and predicted moving averages to forecast short-term trend direction. His firm’s software, VantagePoint Intermarket Analysis Trading Software, predicts market trends with nearly 80% accuracy for interest rates, stock indexes, currencies, energies, metals, grains, meats, and softs, covering a total of 43 financial futures and commodities markets. Market Technologies’ website is www.vantagepointsoftware.com and the phone numbers are 813-973-0496 or 800-732-5407


